Zero-Downtime Deployment Patterns on Kubernetes
Three configuration gaps—not strategy choice—cause most zero-downtime deployment failures.

Zero-downtime deployment on Kubernetes makes one promise: the old version stays live until the new one proves it's ready, then traffic moves over without anyone noticing. Most teams never actually get that. They set a rolling update, watch kubectl get pods turn green, and call it done. But the real cause of dropped requests almost never comes down to picking rolling versus blue-green versus canary. It comes down to three specific gaps: missing or dishonest readiness probes, no graceful shutdown handling, and endpoint propagation delay nobody accounted for.
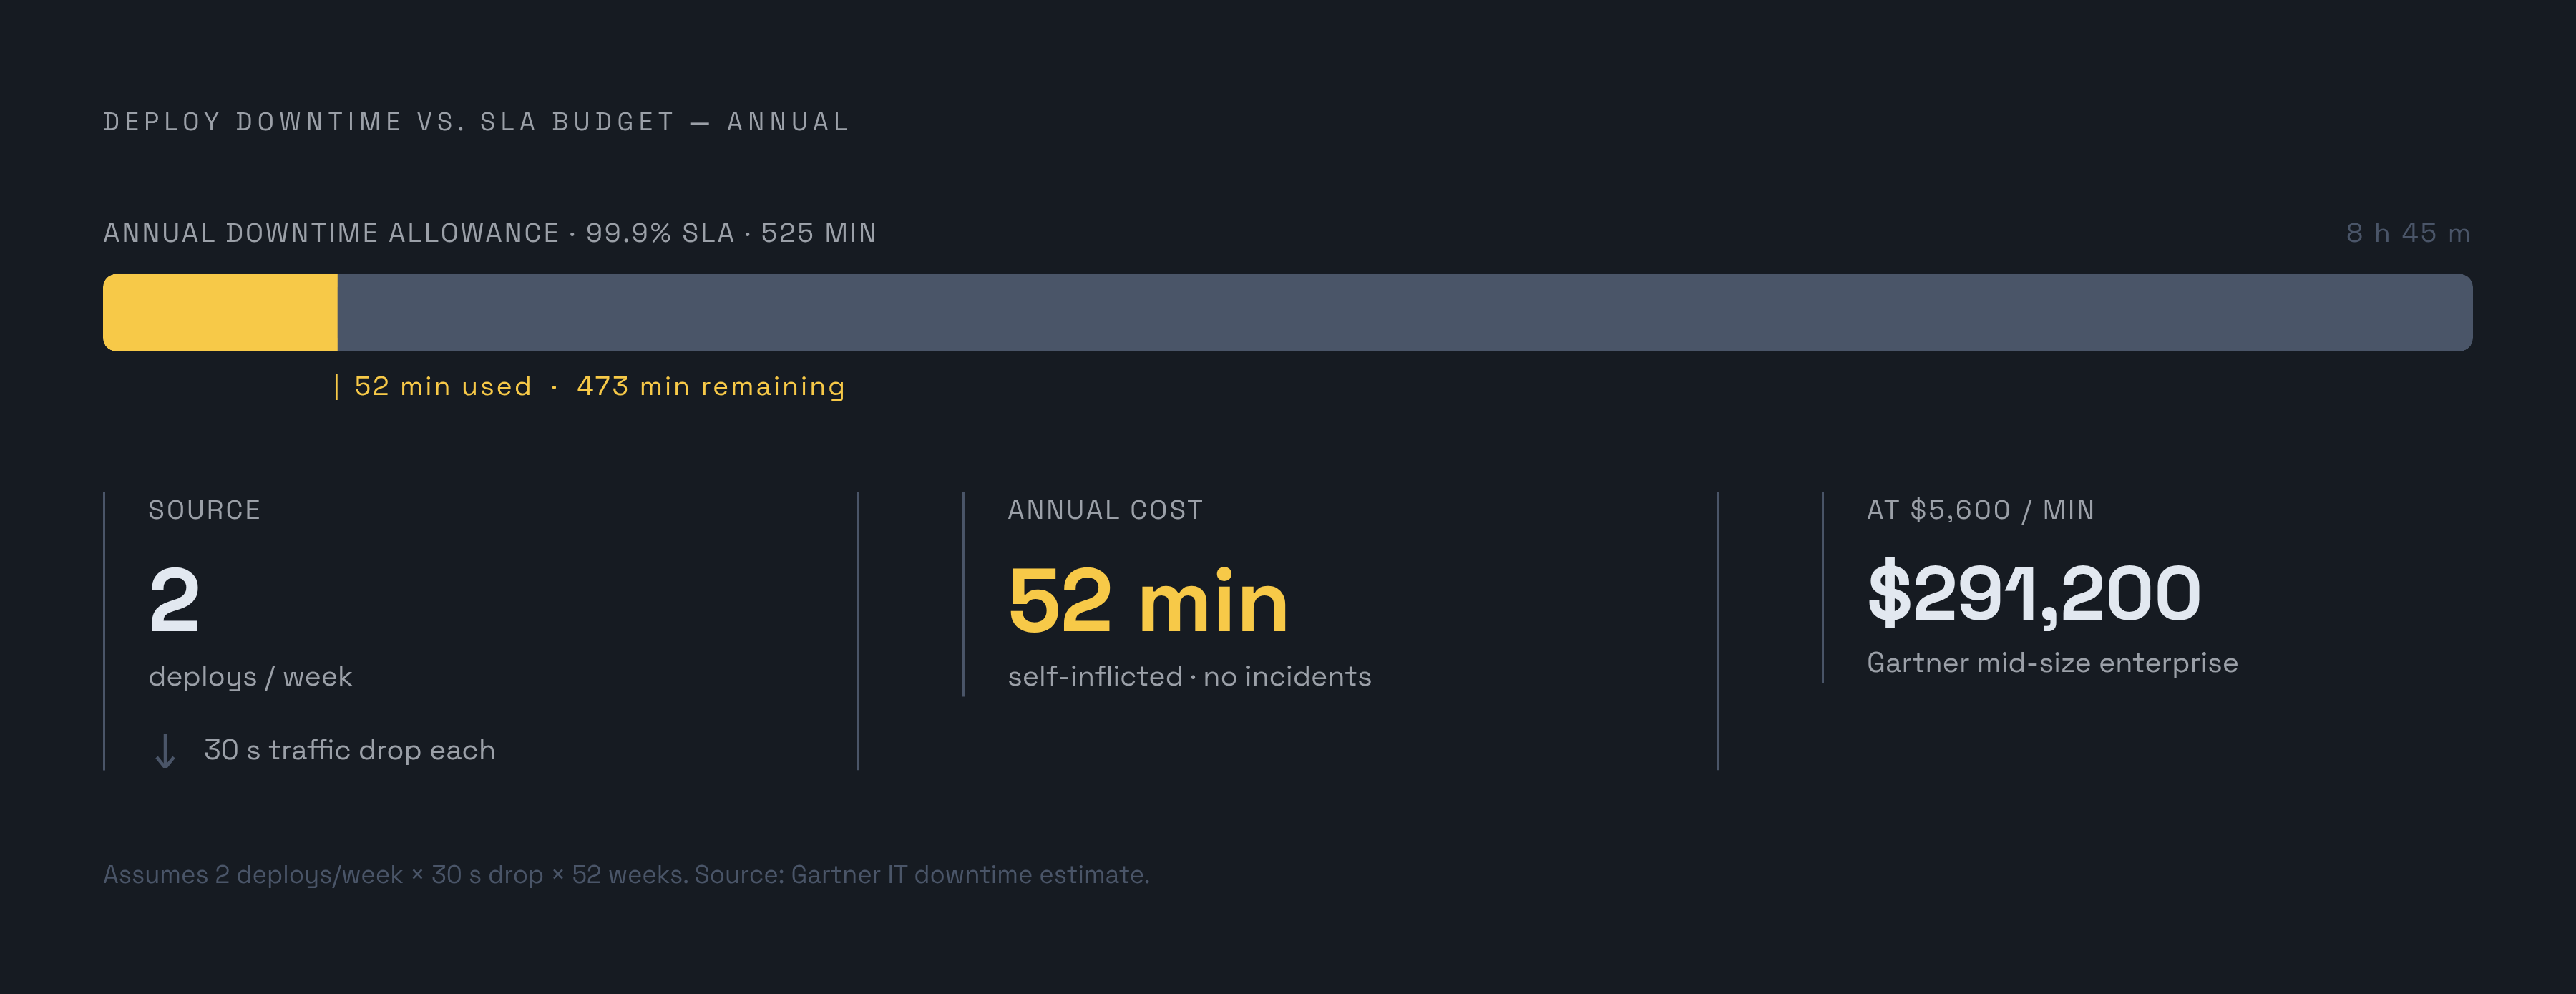
Gartner puts the average cost of IT downtime at $5,600 per minute for a mid-size enterprise. Run that against an ordinary deploy schedule: two deploys a week, each with a 30-second restart that drops traffic. That's a minute a week, which adds up past 52 minutes a year of downtime the team caused itself. No outage, no incident, no bad luck, just a gap in the config. That number alone can eat into a 99.9% uptime SLA, which only allows about 8 hours and 45 minutes of downtime a year. Self-inflicted restarts can burn through a meaningful slice of that budget before a single real incident ever happens.
Fix the three gaps in the right order, and the strategy choice stops mattering much. Skipping them means no strategy saves the deploy: a lying readiness probe or an ungraceful shutdown breaks rolling updates, blue-green, and canary releases the exact same way.
What readiness probes check versus what most configurations assume
Kubernetes doesn't know what "ready" means for any given app. Left unconfigured, it sends traffic to a pod the second the process starts, not the second the app can actually handle a request. That gap, between "process exists" and "process can serve," is where most dropped requests come from.
Three probe types exist, and they do three different jobs. Readiness decides whether a pod gets traffic; it's the actual gate for zero-downtime deployment. Liveness watches for internal deadlocks or crashes and restarts the pod when it finds one, and it has nothing to do with routing traffic. Startup gives a slow-booting app a grace window before liveness checks even start, so a legitimately slow boot doesn't get mistaken for a crash mid-startup.
Pointing readiness and liveness at the same /health endpoint is one of the more common mistakes out there, and it backfires in a predictable way. Say that endpoint checks a database connection. The database goes down, so liveness fails too. Kubernetes restarts the pod. The new pod boots, still can't reach the database, fails liveness again. Now the whole deployment is stuck in a crash loop, and the cause is a probe that was supposed to be indifferent to the database. It's a probe that was supposed to be indifferent to the database and wasn't.
Liveness should only ask if the process is stuck. Readiness should ask whether the pod can actually do its job right now: is the database connection open, are the caches warm, has config finished loading. Not just whether the binary happens to be running.
None of that holds up without the rollout settings to back it. Set maxUnavailable: 0 so the rollout never dips below the ready pods needed for current traffic, and maxSurge: 1 so a new pod comes up before an old one retires. Skipping maxUnavailable: 0 means even a perfectly honest readiness probe won't stop a capacity dip mid-rollout. Probe and rollout setting only work as a pair, never alone.
Graceful shutdown: what happens between SIGTERM and process exit
When Kubernetes decides a pod needs to go, it sends SIGTERM first. What happens next depends entirely on whether the app is actually listening for that signal.
Behavior splits depending on whether the app runs as PID 1 inside the container. A non-PID-1 process usually exits right away on SIGTERM. PID 1, which is the default spot for most containerized apps, ignores SIGTERM by default and just keeps running, oblivious, until Kubernetes gives up and sends SIGKILL.
The minimum bar: stop accepting new connections, finish whatever's already in flight, then exit on its own. terminationGracePeriodSeconds caps how long Kubernetes waits before it sends SIGKILL, and that number needs to comfortably cover the app's slowest realistic request, not its average one.
Signal handling isn't universal across runtimes either. Node.js, Go, and Python each need explicit SIGTERM handling written in, because none of them drain gracefully on their own. Skipping that step, in any of them, causes the app to exit the instant the signal lands, mid-request, no cleanup.
Skipping graceful shutdown keeps the failure mode quiet. Any request in flight when SIGTERM hits gets an error handed back to the client. Skipping graceful shutdown does not raise an outage on a dashboard. A scatter of failed requests during load testing, or a user complaining that checkout broke for no reason, reveals it.
Readiness and graceful shutdown get lumped together a lot, but they're not solving the same problem. Readiness keeps traffic from reaching a pod before it can handle it. Graceful shutdown keeps traffic from getting abandoned once a pod is on its way out. Both need to be in place. Neither one covers for the other.
The endpoint propagation delay and why preStop sleep is not optional
Even with readiness and graceful shutdown both wired up correctly, there's a race condition baked into how Kubernetes shuts pods down. Two things happen at once, independently, the moment a pod gets terminated: the Endpoints controller pulls it off the Service's endpoint list, and the container gets sent SIGTERM. Nothing forces those two events into order.
If SIGTERM lands before the endpoint removal actually propagates out to kube-proxy, the Ingress controller, or an external load balancer, that load balancer keeps sending traffic to a pod that's already shutting down. This is a deliberate trade-off in how Kubernetes was built. The two controllers were never designed to coordinate with each other.
The fix is a preStop hook that inserts a short sleep before SIGTERM reaches the container, buying time for the endpoint change to finish spreading:
preStop:
  exec:
    command: ["sh", "-c", "sleep 10"]
The sleep needs to outlast the actual propagation lag in the cluster's networking setup, which shifts depending on the load balancer and how the cluster's wired. As of Kubernetes 1.34, a native preStop sleep action reached general availability (it shipped as beta, on by default, since 1.30), so clusters running a recent enough version can drop the shell command and use the built-in action directly.
terminationGracePeriodSeconds has to cover the preStop sleep duration plus the app's worst-case drain time, added together. Setting it too short causes SIGKILL to land while the app's still draining requests, undermining the purpose of the sleep.
A missing preStop sleep causes intermittent errors right after a migration to Kubernetes, the kind that vanish the second someone hits refresh. That's rarely a networking problem. It's the load balancer routing a request to a pod that's already mid-shutdown.
How deployment strategy choice interacts with the three configuration gaps
Rolling updates, the Kubernetes default, are where all three gaps bite hardest, because old and new pods serve traffic side by side for the entire rollout. Missing one of the three causes requests to start dropping in a pattern that's genuinely hard to trace, since traffic splits across two versions and the failures don't cleanly belong to either one. Rolling updates also demand database compatibility across both code versions running at once: the expand-contract pattern handles it by adding new columns first, shipping code that reads and writes both old and new schema, backfilling the data, and only dropping the old columns in a later, separate deploy.
Blue-green trades the endpoint propagation race for a different set of costs. Traffic switches all at once, by flipping the Service selector from old environment to new, so there's no window where both versions serve live traffic together. Rollback is close to instant: flip the selector back. Readiness probes are still required on the green environment before that switch happens; sending traffic to a green environment that isn't ready is the same failure wearing a different strategy's clothes. Blue-green needs roughly double the infrastructure during the deployment window, and reports indicate that a single bad deployment can cost companies over $300,000. That kind of exposure makes near-instant rollback worth paying double for.
Canary limits the blast radius by exposing only a slice of traffic to the new version before rolling further. A simple version needs no traffic-splitting infrastructure at all: run 1 canary pod next to 9 stable ones, and roughly 10% of traffic is on the new version just from the replica ratio. All three configuration gaps still apply, in full, to that canary pod. A canary without a working readiness probe drops requests for whatever slice of users it happens to serve, quietly, without announcing itself. Canary also demands version-aware metrics, since without them there's no telling whether an error spike came from the canary or the stable fleet.
Rolling needs no extra infrastructure, rolls back in minutes, and runs both versions briefly at once, which fits most Kubernetes workloads by default. Blue-green needs double the infrastructure, rolls back in under 10 seconds, and never runs both versions together, which suits stateless web tiers and regulated industries where a clean cutover actually matters. Canary needs minimal extra infrastructure, rolls back quickly through traffic rerouting, and runs both versions simultaneously on purpose, which fits high-traffic APIs where even a small error rate touches a lot of people at once.
Pod Disruption Budgets as a backstop for cluster-level disruptions
Everything above deals with disruption an app causes on its own. A separate category comes from the cluster itself: node maintenance, autoscaler drains, infrastructure upgrades that have nothing to do with shipping code.
A Pod Disruption Budget sets the minimum replica count that has to stay available during that kind of voluntary disruption. Think of it as a contract between what the app needs and what cluster operations is allowed to do to it. When kubectl drain or an operator tries to evict a pod, the admission controller checks any active PDBs first. If evicting that pod would drop the app below its floor, the eviction gets denied, and stays denied, until something changes.
PDB design should follow what the app actually is. A stateless web tier running 6 replicas can usually tolerate maxUnavailable: 2 and shrug off aggressive maintenance without breaching availability. A 3-node PostgreSQL cluster needs maxUnavailable: 1 just to hold quorum. Batch jobs are better served by pairing a PDB with scheduling constraints that carve out maintenance-friendly windows.
The cluster autoscaler checks PDBs before it picks a node to terminate, simulating the eviction first to see if pulling that node would violate anyone's budget. Nodes sitting behind tight PDBs effectively turn into lower-priority targets for scale-down.
Setting a PDB too tight, minAvailable equal to the full replica count, say, prevents the autoscaler from draining that node, which can block cluster maintenance indefinitely. Watch kube_poddisruptionbudget_status_current_healthy against kube_poddisruptionbudget_status_desired_healthy. A PDB that's blocked evictions for hours is a signal, and it usually means the app needs more replicas, or the availability target it's been given isn't realistic. On the CI/CD side, pipelines need to account for PDBs directly, since a pipeline that ignores them can stall mid-rollout the moment the budget refuses to let a pod go.
Verifying the configuration works before it matters in production
All three gaps can look closed on paper and still leak requests, because the real failure point is calibration. A probe endpoint returns the wrong status a beat too early, a drain routine doesn't quite finish, or a sleep duration runs a few seconds short. The only way to know for sure is to test under real traffic. Reading the config file and assuming it's fine doesn't count as verification.
The basic method: fire continuous HTTP requests at the service during an actual rollout and count anything that isn't a 2xx response. Tools like hey, vegeta, or k6 handle sustained load fine while kubectl rollout runs in the background. With all three gaps genuinely closed, the expected result is zero non-2xx responses across the whole rollout window. A single 502 or 503 in that window means a gap is still open somewhere.
Check each probe on its own terms. The readiness endpoint should return 503 during startup, before the app can actually serve, and only flip to 200 once every dependency check clears. The liveness endpoint should never touch an external service, full stop; a database outage should never be able to trigger a liveness failure. The startup probe's failureThreshold times periodSeconds needs to cover the app's worst-case startup time.
Graceful shutdown gets verified by sending SIGTERM directly to a pod mid-request and confirming that in-flight request finishes before the process exits. Endpoint propagation gets verified by timing the actual gap between pod termination and the pod disappearing from the Service's endpoint list, then checking the preStop sleep comfortably outlasts that measured gap.
Teams hitting elite performance on DORA's metrics deploy on demand, often several times a day, hold their change failure rate low, and recover fast when something breaks anyway. That pace only holds up when this whole verification loop runs automatically inside the pipeline. It falls apart as a manual checklist someone works through before a big release.
How much of this configuration you own depends on platform choice
Everything covered so far is correct for a team running Kubernetes directly, and on raw Kubernetes, every piece of it lands on that team's engineers. The readiness endpoint has to be written into the app itself. PreStop hooks need to stay current across every Deployment. PDBs have to track replica counts as services scale up and down. terminationGracePeriodSeconds needs revisiting any time the app's behavior shifts. None of it is a one-time setup. It's ongoing maintenance, indefinitely.
That overhead lands differently depending on team size. A team with dedicated platform or DevOps engineers can own this configuration and keep tuning it as things change. A small engineering team, which is the normal shape of a startup or an early growth-stage company, doesn't have that luxury: every hour spent tuning preStop sleep durations is an hour not spent on the product itself.
Kubernetes adoption is projected to reach 96% among container-based organizations, so most teams end up running on it whether or not they actually want to own this level of infrastructure work. A platform-as-a-service that deploys into a team's own cloud account, rather than a shared-tenant environment, can enforce correct rolling update settings, ship sane readiness probe templates, and set reasonable preStop defaults automatically. The team writes the /ready endpoint. The platform handles the rest of the wiring.
A shared-tenant PaaS can hide this configuration completely, but it takes real control away to do it. A platform running inside the team's own cloud account can automate the repetitive, undifferentiated parts of this setup while leaving the team in charge of its own infrastructure, which is the better deal for anyone who expects to scale past the basics. Either way, the three gaps, readiness, graceful shutdown, endpoint propagation, are all solvable. The only question left is who ends up owning the fix.
Sources
- Zero-Downtime Deployments on Kubernetes: Rolling Updates, Blue-Green, and Canary (2026)
- Kubernetes deployment strategies: kubernetes deployment strategies for 2026
- Why Your Kubernetes Readiness Probes Are Lying During Rolling Updates
- Configure Liveness, Readiness and Startup Probes
- Liveness, Readiness, and Startup Probes
- oneuptime.com
- kubernetes.io