Distributed Tracing Setup for Kubernetes-Based Microservices
OpenTelemetry, the Collector, and a backend form the three-decision framework.
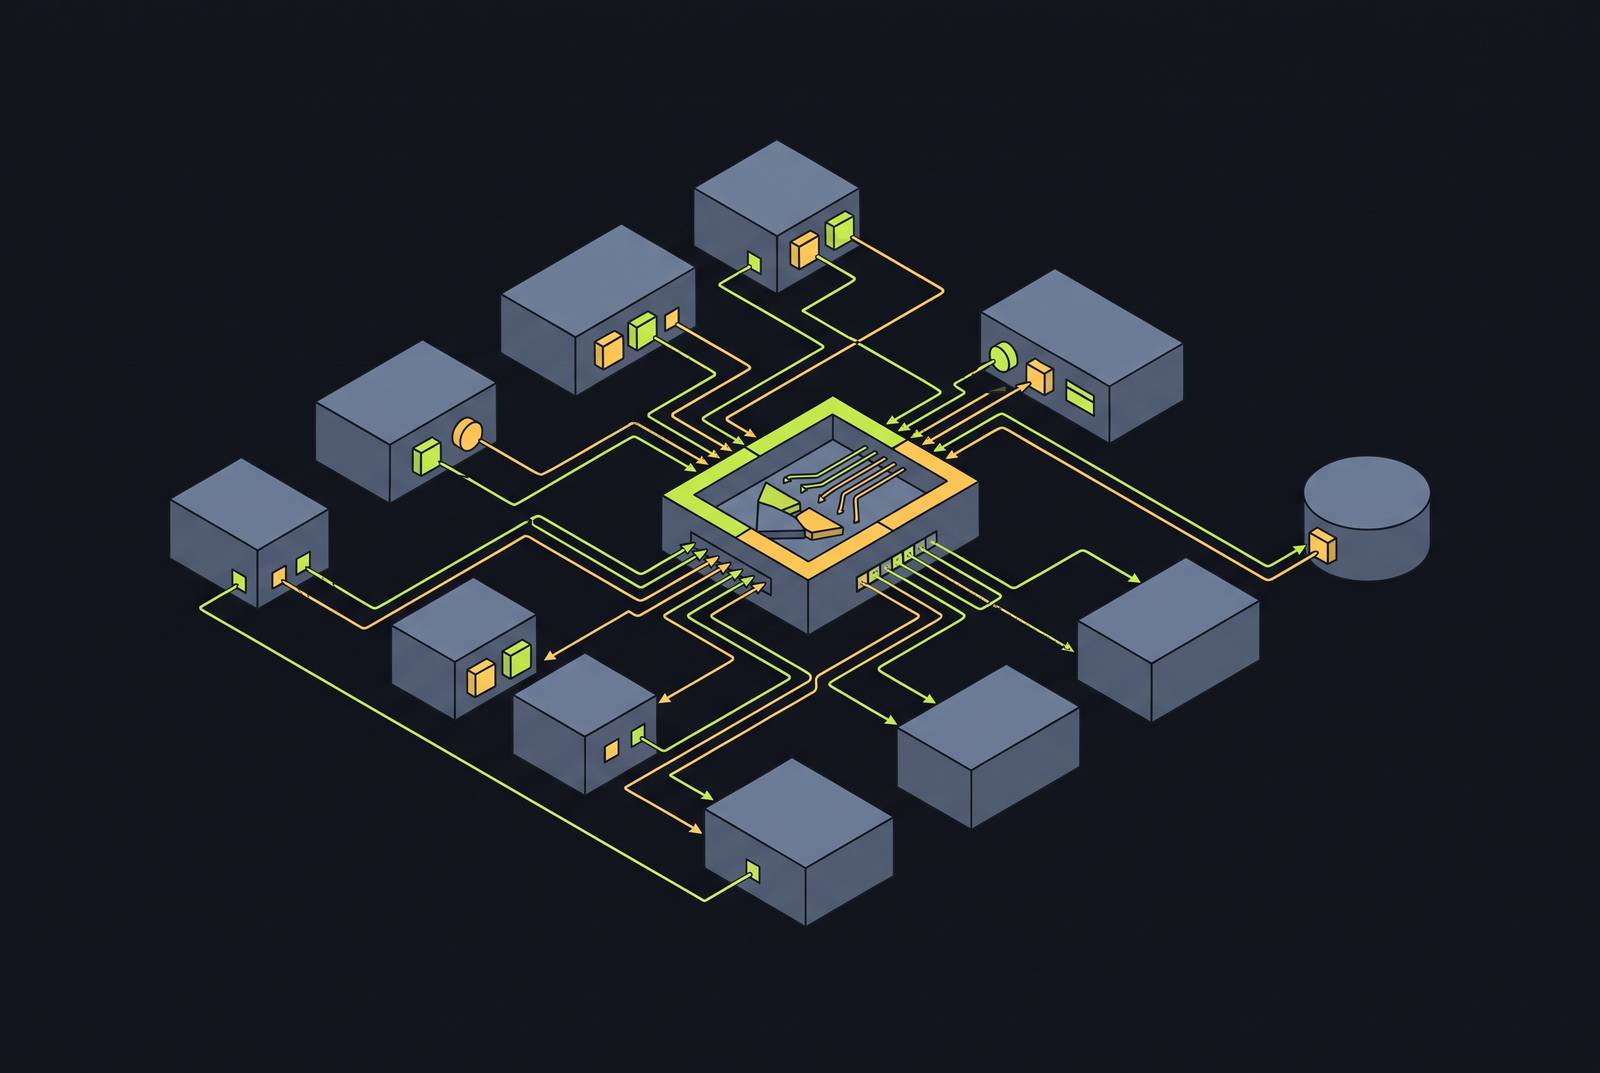
Getting distributed tracing right in a Kubernetes microservices setup comes down to three decisions made in order: pick an instrumentation standard, wire a collector pipeline, and choose a backend. Each decision has specific Kubernetes mechanics attached to it, and getting any one of them wrong is what makes tracing setups fail quietly in production rather than loudly in a code review.
Why request tracing becomes non-negotiable once a Kubernetes cluster has more than a handful of services
A monolith fails in one process. One stack trace, one team, one place to look. Microservices don't offer that courtesy. Service A returns a 503, the actual cause sits in service C three hops downstream, and every dashboard along the way shows green. Nothing is technically broken from any single service's point of view. That's the trap.
Kubernetes doesn't just fail to fix this, it makes the problem structurally worse. Pods churn constantly as autoscalers add and remove replicas, a deploy can silently change which version of a service answers a given request, and IP addresses shift under load in ways no engineer is tracking in real time.
Logs and metrics don't close this gap, because they were never built to. They record what happened inside a service. What happened between two services, the handoff itself, is exactly where the failure tends to live, and it's exactly what logs and metrics don't see. A metrics dashboard will tell you the Notification Service is slow. It won't tell you why, and it definitely won't tell you it's slow because of an outbound call three layers deep.
Different teams owning different services makes this an organizational problem as well as a technical one. Different teams own different services, and nobody wants to hand another team log access just so they can debug a shared incident. A trace ID solves that cleanly: it's a shared object every team can query independently, without opening up internal logs or credentials. Mechanically, what's actually happening is simple. Each hop a request makes becomes a span, carrying a name, a duration, and metadata about what it did. Every span from a single request shares one trace ID, and stitched together, those spans form a timeline of the entire journey, start to finish. That timeline is the entire point.
Why OpenTelemetry is the instrumentation standard to build on in 2026
The CNCF graduated OpenTelemetry in May 2026, placing it in the same governance tier as Kubernetes and Prometheus. That's not a popularity contest result. Graduation status is a statement about maturity, governance, and staying power, and it matters because instrumentation is the one layer of an observability stack that's expensive to rip out later.
The adoption numbers back up the graduation. OpenTelemetry has more than 12,000 contributors spread across over 2,800 companies, with 49% of teams already running it in production and another 26% evaluating it Apica / OpenTelemetry Best Practices Coralogix / Distributed Tracing in Microservices. That's a widely adopted tool now. That's the default.
OpenTelemetry decouples how data gets generated from how it gets analyzed, and that architectural separation is what drives the adoption curve. Instrument a service once, and send the output to any OTLP-compatible backend: Jaeger, Grafana Tempo, Datadog, or Honeycomb. OTel breaks that coupling. Swapping backends becomes a configuration change.
Not every part of OpenTelemetry has reached the same maturity, and that distinction matters for what gets treated as production-ready. Traces, metrics, and logs are stable across the major SDKs, and safe to build critical infrastructure on. Continuous profiling is newer: it entered public Alpha in March 2026, and it isn't ready to carry critical production workloads yet. Semantic conventions are a mixed bag too. Database conventions are labeled "Mixed," between draft and settled, while messaging conventions and the newer gen_ai conventions built for LLM workloads remain in active development. Anyone building tracing into an AI inference pipeline should plan around that instability rather than assume it's settled.
On the instrumentation side itself, zero-code instrumentation now covers the major languages and frameworks, automatically wrapping inbound requests and outbound calls without a single line of manual setup. That covers most of the boilerplate. What it doesn't cover is business logic specific to the application, a payment validation step for instance, since no generic framework hook knows to watch for that. Manual instrumentation still has a job to do there, just a much smaller one than it used to.
Choosing OpenTelemetry answers what standard to instrument against. It doesn't answer how spans from every service actually get somewhere useful without the collection layer buckling under the load. The vendor-lock-in argument holds that instrumenting against a vendor SDK couples data generation to data analysis, whereas OTel breaks that coupling, letting teams swap backends without re-instrumenting.
How the OpenTelemetry Collector fits into a Kubernetes deployment
The Collector's job is straightforward to describe: it receives spans over OTLP, gRPC on port 4317, HTTP on port 4318, processes them, and exports them to a backend. It sits between application code and storage, and that position in the pipeline is what makes it valuable, not just a passthrough pipe.
Skipping the Collector and shipping spans straight from app code to a backend is possible, but it throws away most of what makes tracing manageable at scale. The Collector batches spans before flushing them, cutting down on network chatter and write pressure against the backend. It enriches every span with Kubernetes context, pod name, namespace, node, deployment labels, none of which the application itself knows anything about. It's the place where sampling decisions get made centrally instead of scattered across every service's code. And it's where PII or secrets get stripped out of span attributes before anything leaves the cluster.
Deployment shape depends on what's being collected. A DaemonSet, one Collector pod per node, works well for node-level telemetry and host metrics. A Deployment, whether sidecar-style or standalone, gives more isolation control, running one Collector per namespace or per workload. For managing this at scale, the OpenTelemetry Operator handles Collector custom resources and upgrades, and it's the recommended path for production Kubernetes environments rather than hand-rolled manifests. Installing the Operator itself requires a TLS certificate for its webhook, and cert-manager is the default recommended route, though a self-signed or custom certificate works too; the sequence is cert-manager first, wait until it reports Available, then apply the Operator manifest into an observability namespace.
Propagation is where a lot of tracing setups quietly fall apart, and it deserves specific attention. The W3C traceparent header is what carries trace context across HTTP hops, holding the trace ID, the parent span ID, and a sampling flag. Async workflows are, without much competition, the most common place traces break.
Teams running Istio get a meaningful bonus here. Istio 1.22 and later supports configurable OTLP export, which does need explicit MeshConfig setup, but once that's wired, mesh-generated traces correlate directly with application spans. That's infrastructure-level tracing arriving almost for free on top of application tracing that's already in place.
One configuration detail is easy to skip and expensive to skip: the memory_limiter processor needs to sit before the batch processor in the pipeline, not after.
Once the Collector is running and spans are actually flowing through it, the next decision is where all that data lands, and that choice carries real cost and operational weight. The Collector belongs in the cluster and should not be bypassed. There are distinct deployment modes in Kubernetes. gRPC propagation uses metadata headers, while messaging queues such as Kafka and SQS require explicit carrier injection at publish time and extraction at consume time, making async workflows the most common place traces break. The memory_limiter processor should be configured before the batch processor in the pipeline, which prevents OOM under spike load.
Choosing a tracing backend: Jaeger, Grafana Tempo, and full-platform options compared on the dimensions that matter in production
Jaeger speaks OTLP natively, with no adapter layer needed in between. Cost is pure infrastructure cost.
The all-in-one, in-memory mode (Jaeger v2.21.0 in current examples) defaults to an unbounded max_traces setting, with 100,000 showing up as a common example value rather than a hard ceiling, and is meant for development and local testing only, not production. That's fine for local development. It is not a production setup. The recommended way to deploy Jaeger v2 today is through the OpenTelemetry Operator, and the standalone Jaeger Operator is worth avoiding for anything new. Underneath, storage choice still matters: Cassandra offers raw write throughput, while Elasticsearch is the better choice when advanced trace search and filtering take priority over ingest speed.
There's a documented pattern for end-to-end distributed tracing in Kubernetes with Grafana Tempo and OpenTelemetry, tailored for microservices. Tempo makes the most sense for teams already living in Grafana dashboards and using Loki for logs, since it keeps the observability stack in one UI. It's available self-hosted or as a managed option through Grafana Cloud.
Then there's the full-platform commercial tier: Datadog, New Relic, Sematext, Middleware, and Dynatrace. OTel instrumentation ports cleanly to any of them without rework. Sematext is built natively on OTel, generates an interactive service map automatically, and layers in AI-based anomaly detection across more than 100 integrations, Kubernetes included. Datadog and New Relic both run usage-based pricing, meaning cost scales directly with data volume, which is precisely the lever tail-based sampling controls. Dynatrace tends to fit best with large teams running genuinely complex distributed systems.
The portability point changes how much this decision should stress anyone out. Since all of it runs through OTel instrumentation, moving to a different backend later is a Collector config change. The backend decision still has to be made, but it no longer locks the team in the way it used to.
Choosing a backend doesn't solve the problem of what to do about volume, though. A pipeline that stores every single span will either blow through the observability budget or fall over under write pressure, and that's exactly where sampling strategy comes in. The selection dimensions to weigh are self-hosted vs. managed, storage model, query capability, cost structure, OTel nativity, and whether you want tracing-only or unified observability. Jaeger is an open-source, CNCF project, originally built at Uber, and is one of the most widely adopted tracing backends in the cloud-native ecosystem per S5. Two deployment paths matter. In production, a 2-replica Deployment backed by Elasticsearch (version 8.11.0 in the source example) is used, with HPA scaling on CPU utilization, TLS to Elasticsearch, and Elasticsearch index sharding configured per data type, so spans, services, dependencies, and sampling each get their own shard/replica settings. Grafana Tempo is discussed as a tracing backend. Middleware offers eBPF-based collection, minimal manual instrumentation, unified traces/logs/metrics, and pay-as-you-go pricing at $0.30/GB per S5, relevant for teams that want to minimize instrumentation work.
Sampling strategy: how to keep the traces that matter and discard the ones that don't
Start with the baseline rule: nobody storing 100% of raw trace volume survives it at any meaningful request rate. The volume math simply doesn't work.
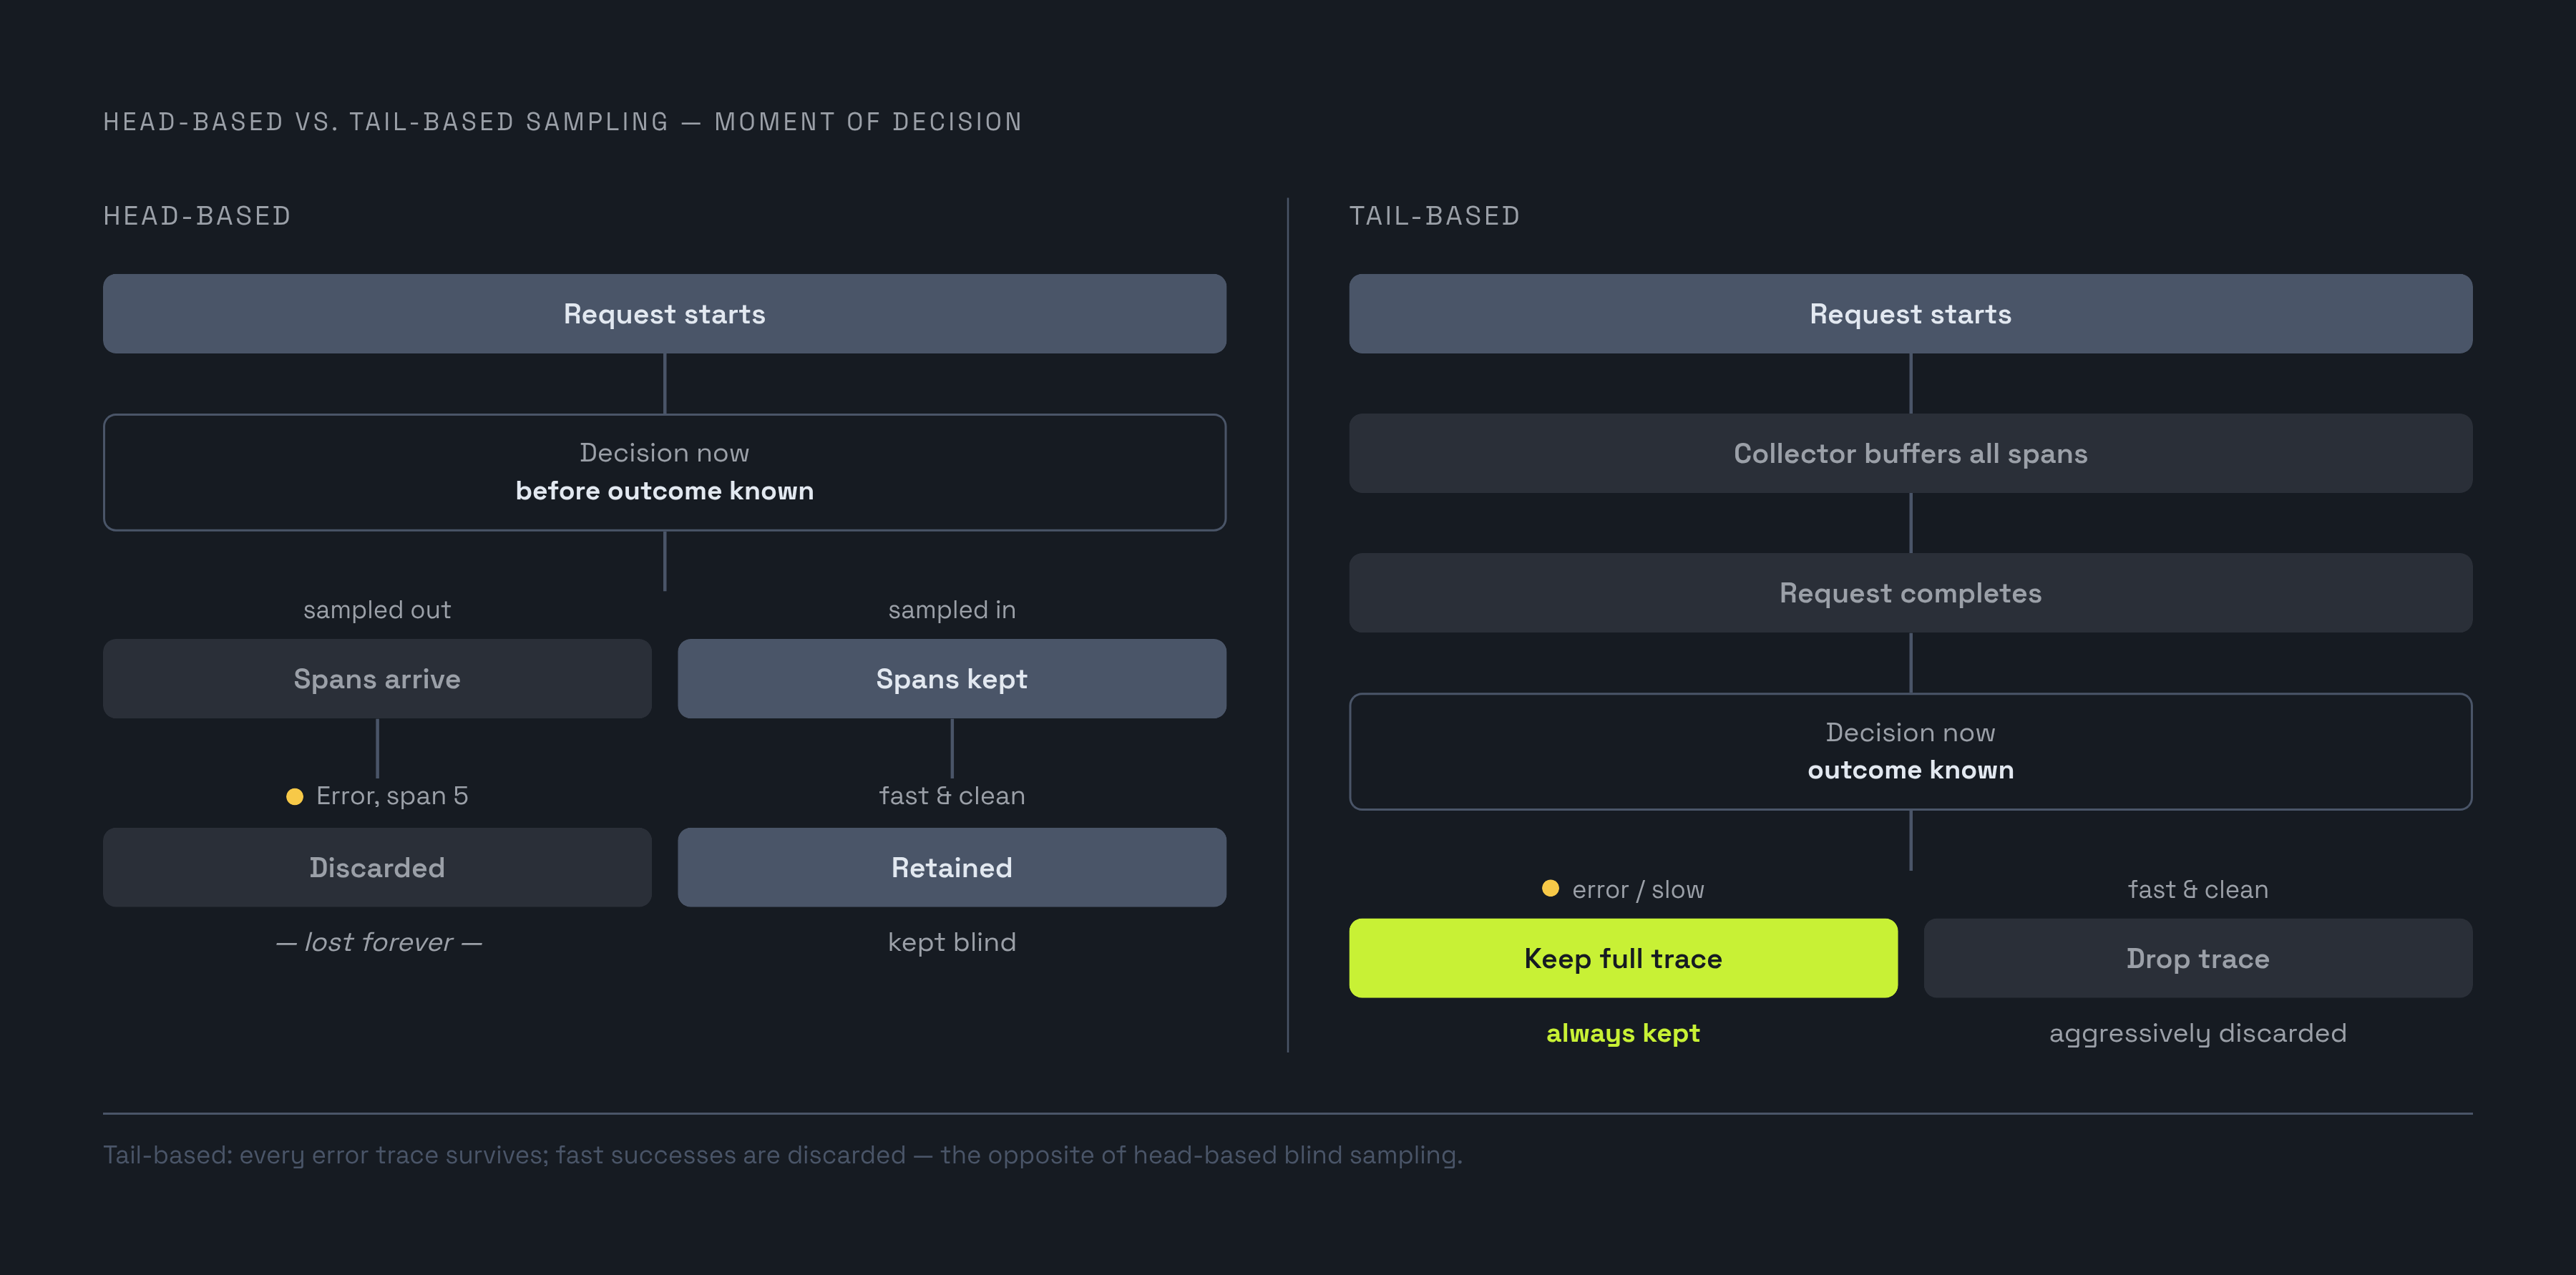
Head-based sampling makes the keep-or-drop decision at the very start of a trace, before anyone knows how it turns out. It's simple and cheap to run. The tradeoff is blunt: a trace sampled out at the start is gone, even if it would have revealed an error five spans later.
Tail-based sampling flips the order. The Collector buffers all the spans belonging to a trace until the request finishes, then keeps or discards it based on the actual outcome. Every trace with an error or high latency gets kept, in full. Fast, successful requests get sampled at a much lower rate, since they're rarely the data anyone needs during an incident. This only works because the Collector, not scattered application code, is the one making the decision, consistently, in one place.
The cost logic is simple. Storing every successful, fast trace is storing proof that things worked, which is expensive to keep and almost never gets queried. Storing every error trace is storing proof that something broke, which is comparatively cheap and is exactly the data that gets pulled up during debugging.
This distinction sharpens further around AI inference workloads. Requests that succeed within a normal latency range are strong candidates for aggressive sampling, but slow inference calls and failed model-serving requests should get kept without exception, because the latency spread on inference traffic is wide enough that normal and abnormal results actually matter.
What a trace tells you during an incident: reading spans in production
A real debugging sequence illustrates the payoff cleanly. Expanding that Notification Service span shows an internal call out to a third-party SMS API, and that call is getting rate-limited.
Without a trace, the story available is "Notification Service is slow," which is a metric, not an explanation. With the trace, the story becomes "Notification Service is slow because of this specific outbound call," and that's a root cause someone can actually act on.
Reading a waterfall view isn't complicated once the layout clicks. Time runs left to right along the x-axis, child spans nest indented under their parents, gaps between spans usually mean network or queue time, and wide spans with no children underneath are where compute is actually being spent.
Traces don't work in isolation, either. OpenTelemetry logs can carry trace IDs and span IDs directly. This lets you jump from a specific span straight to the log entries generated inside it during the same window. Traces answer where the time went. Logs answer what happened inside that span while it was running. Profiling adds a third layer: traces identify which service is slow, profiling identifies which function inside that service is actually burning the time, and the two are complementary rather than duplicating each other.
There's also a structural payoff that appears in the auto-generated service dependency map as a side effect. Running Istio alongside the OTel Collector produces an auto-generated service dependency map, built from live trace data rather than a diagram some engineer drew and forgot to update, it reflects exactly what called what over the last hour. For teams running multiple clusters, that context needs an extra label identifying which cluster a given span came from, added explicitly in Collector configuration; skip that step, and a trace crossing cluster boundaries loses track of where each piece actually ran.
Production failure modes specific to Kubernetes that break traces silently
A handful of Kubernetes-specific failure modes break tracing quietly, appearing as gaps in the data long before anyone notices, usually during an actual incident.
Dropped traceparent headers top the list. One service in the call chain that fails to extract or re-inject the header splits the trace into disconnected fragments, and this occurs most often in legacy services newly added to a mesh, services running custom HTTP clients, or any hop through a message queue that skipped explicit carrier injection. The auto-instrumentation gap around async messaging compounds this. Zero-code instrumentation handles inbound HTTP and outbound HTTP or gRPC automatically, but SQS needs explicit producer and consumer instrumentation regardless of language. Kafka and RabbitMQ get partial coverage depending on the language and runtime (Java and.NET agents handle more of it than others), but injection and extraction into message metadata still has to happen by hand in plenty of cases.
Collector memory pressure is its own recurring failure. Tail-based sampling makes this worse by design, since buffering full traces until completion adds real memory overhead, and Collector pods need to be sized with that in mind.
Kubernetes' own churn creates a quieter failure. If a pod gets evicted or rescheduled mid-request, its span may never reach the Collector at all, and the fix is configuring the batch processor's send_batch_timeout to be shorter than the pod's termination grace period, so spans flush out before the pod disappears. Clock skew across nodes causes a stranger-looking failure: Kubernetes doesn't guarantee synchronized clocks across nodes, and when timestamps drift, waterfall views can show child spans starting before their own parent span did. NTP synchronization at the node level is the fix, and checking for it during initial trace validation catches drift before it's mistaken for a real ordering bug.
Last, sampling flag inconsistency is a mistake that's easy to make twice without realizing it. Set head-based sampling to 10% in the SDK, then apply a separate sampling rule in the Collector on top of it, and the effective sample rate is the product of both, not either one alone. Define it once, and know exactly where that one place is.
Sources
- Distributed Tracing in Microservices: Implementation Guide
- How to Implement Distributed Tracing with Jaeger in Kubernetes
- Best 9 Distributed Tracing Tools in 2026
- End-to-End Distributed Tracing in Kubernetes with Grafana Tempo and OpenTelemetry | Civo
- OpenTelemetry Best Practices 2026: Cut Costs | Apica
- How to Set Up OpenTelemetry for Multi-Cluster Kubernetes Tracing
- How to Deploy OpenTelemetry Operator for Kubernetes Auto-Instrumentation
- How to Deploy the OpenTelemetry Collector on Kubernetes