Achieving 99.99 Percent Uptime for AI Inference Services
GPU inference needs its own reliability ladder beyond standard web service benchmarks.
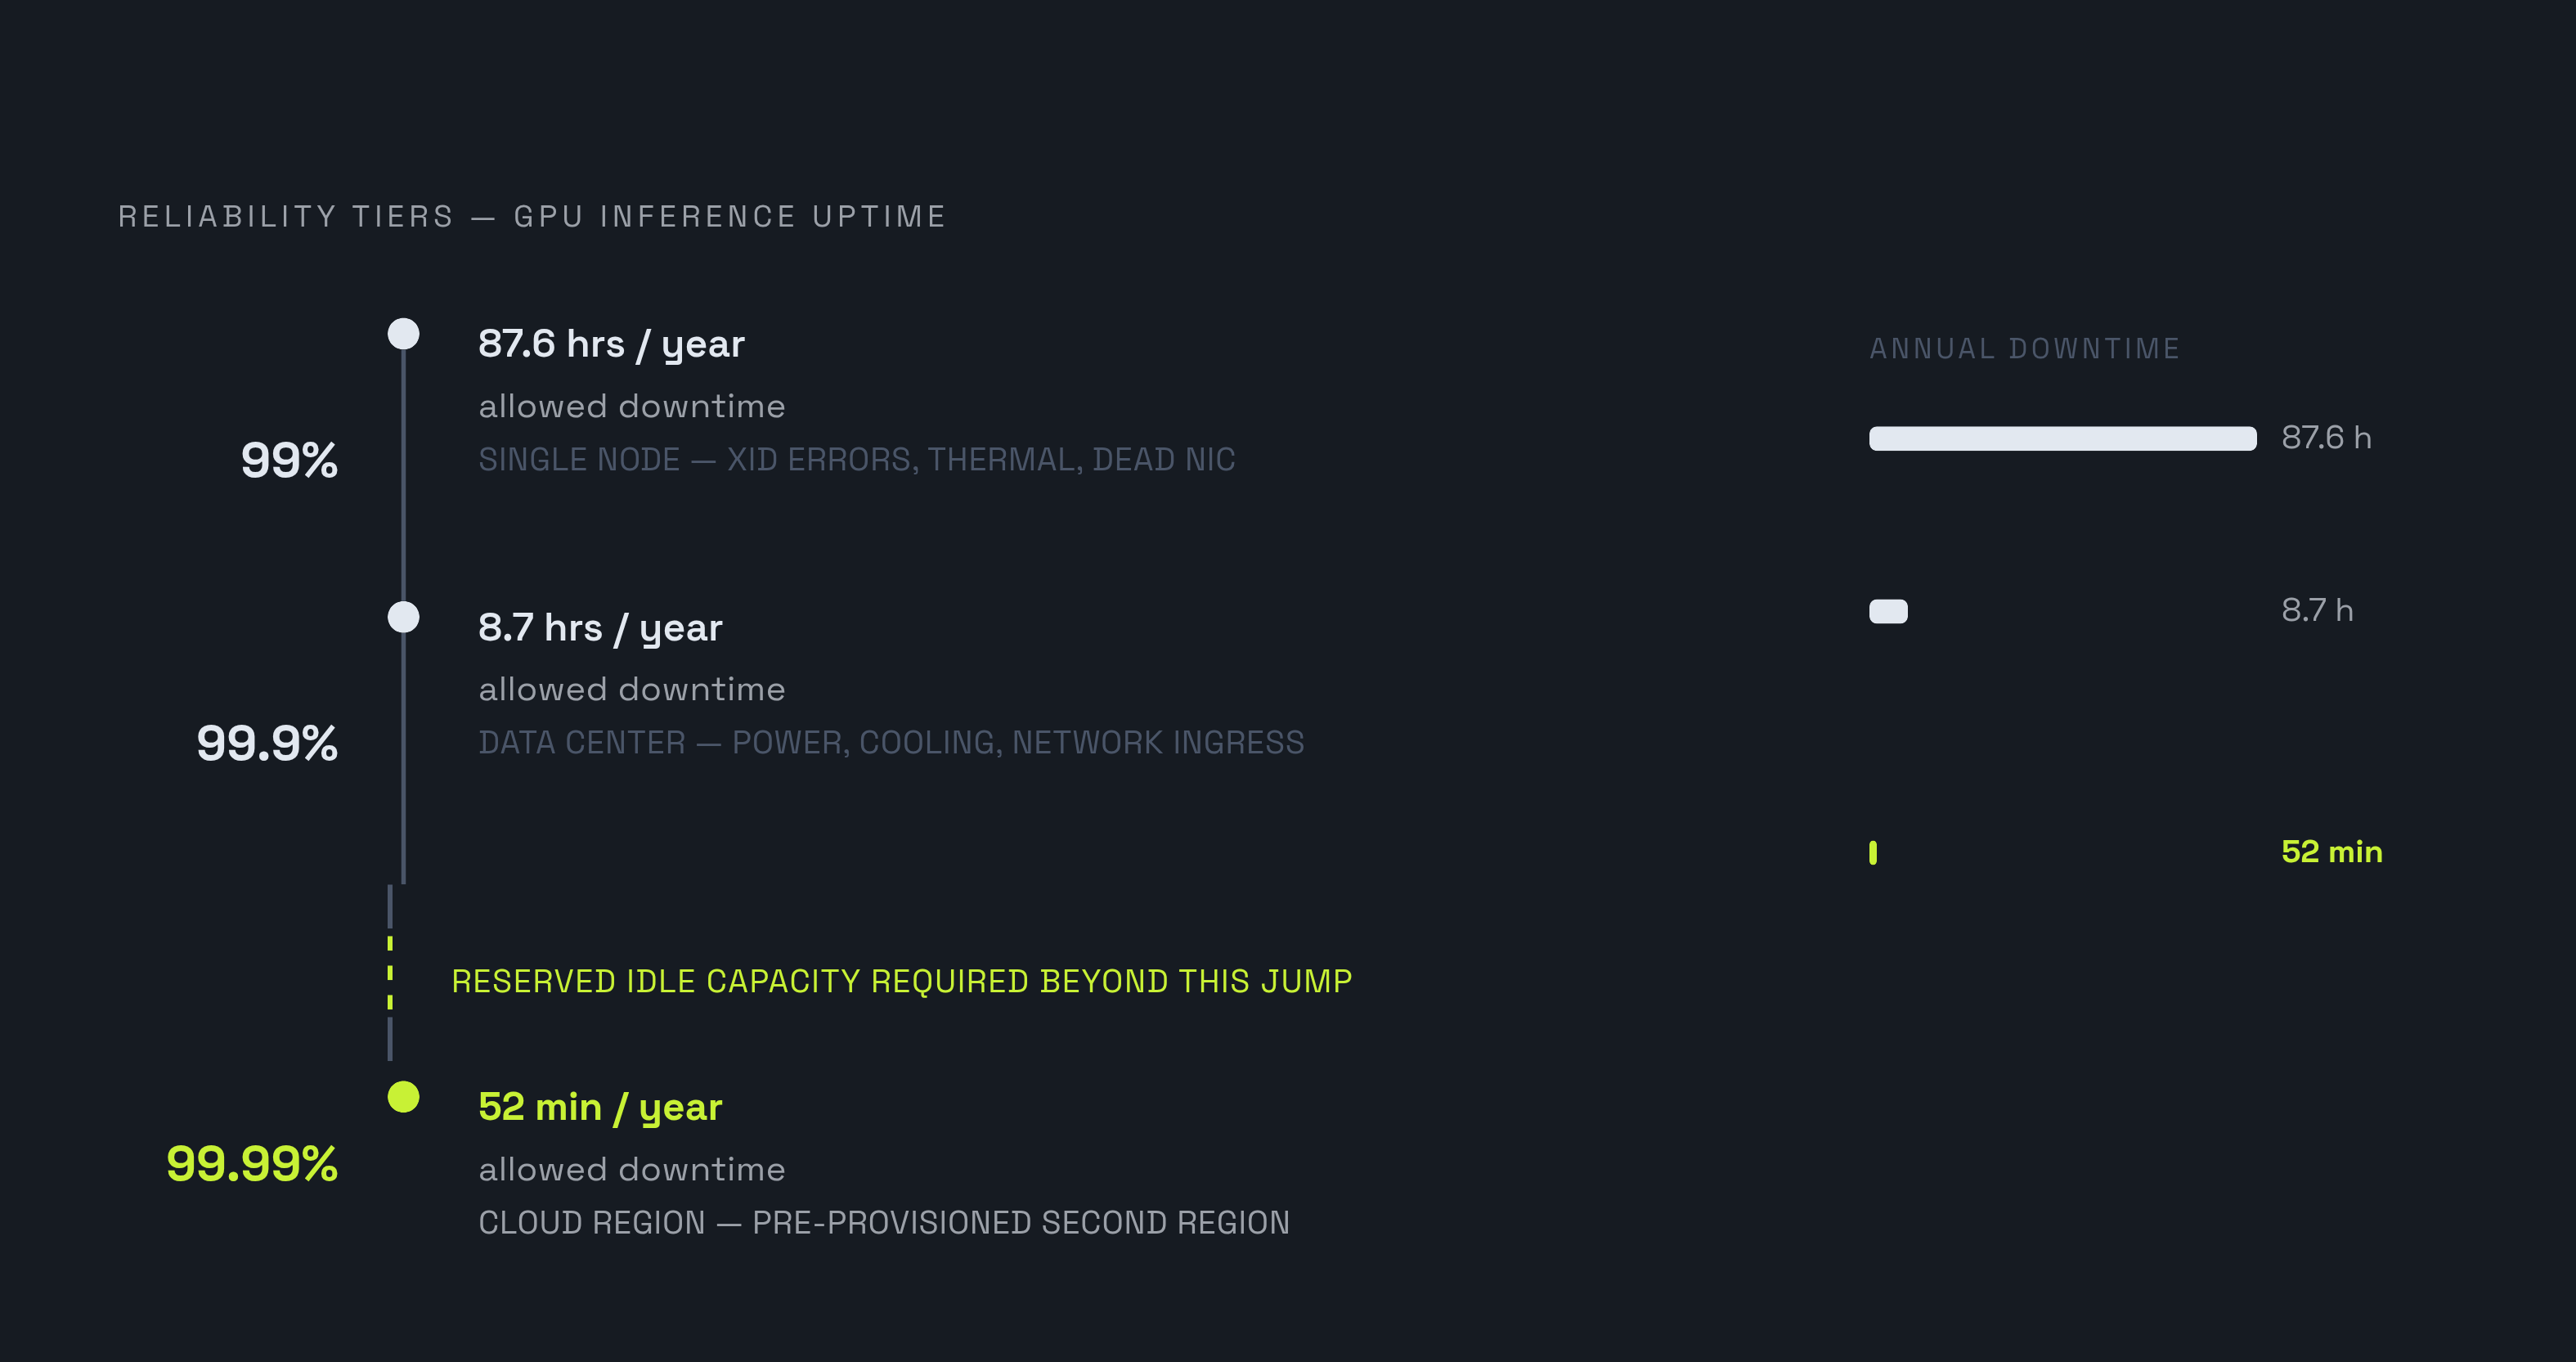
99.9% uptime allows 8.7 hours of downtime a year. 99.99% allows 52 minutes. The gap between those two numbers looks small on paper and turns out to be the entire game: each additional nine is not a harder version of the same problem, but a different engineering problem aimed at a different way the system can break. Treating four-nines as a vendor checkbox, something a sales page promises, obscures the design decision actually driving it. It's a design decision made at the architecture level, and every tier along the way maps to a specific failure domain a team has to be ready to survive.
GPU hardware fails more often than the CPU infrastructure most reliability playbooks were built around, and inference systems get tuned hard for speed (targets like a million tokens served, 200 tokens per second, sub-50ms time-to-first-token on voice models aren't rare asks anymore). That tuning eats into the slack that would otherwise go toward reliability. So the standard three-nines, four-nines conversation borrowed from web services doesn't map cleanly onto GPU inference. It needs its own ladder.
How GPU inference fails differently from the services reliability playbooks were written for
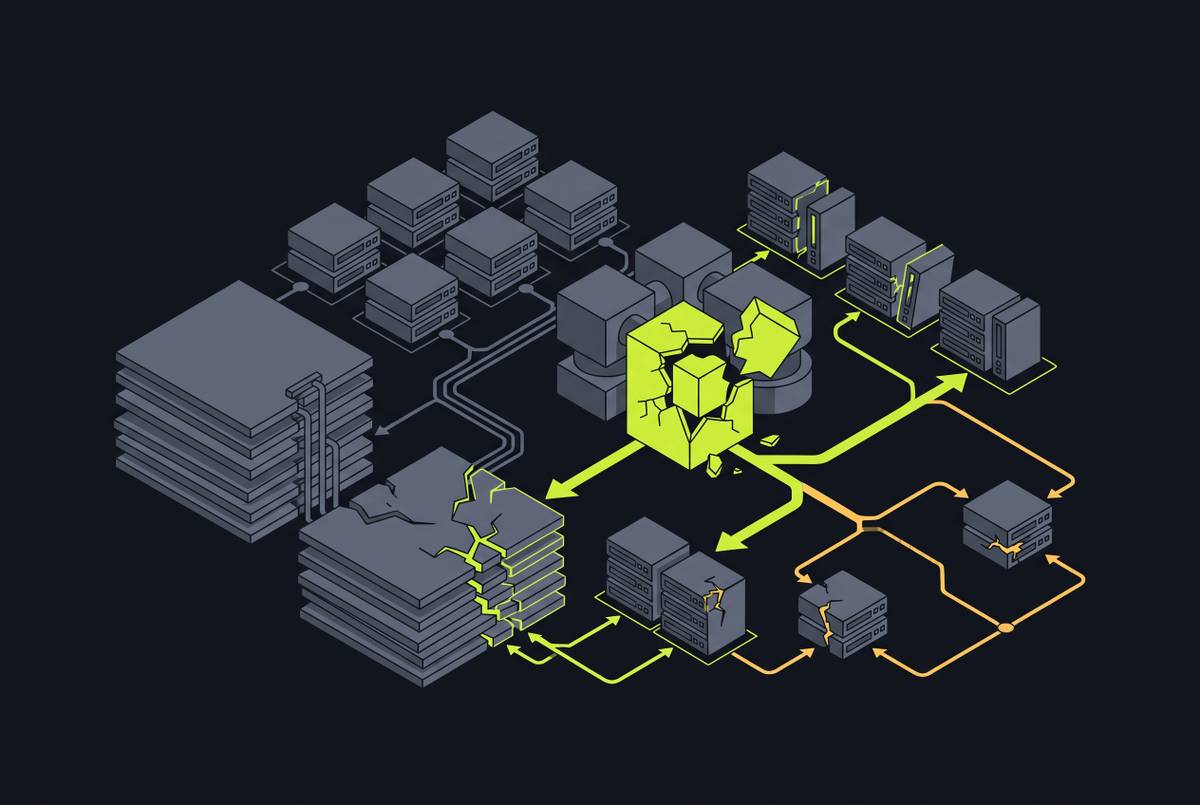
Failures in a GPU inference stack are visible at a different layer than the one where they start. They're layered, and they're deceptive.
At the compute layer, an ECC error in VRAM can quietly corrupt model weights. The request still comes back with a response, it just can't be trusted. Thermal throttling drags output quality down long before any alert fires. An NVLink fault, a driver crash, a dead NIC, or a failed CPU can each take the machine down even when the GPU itself is fine.
The network layer has its own version of this. Switches fail outright, but other network components can degrade more quietly, hurting performance well before they cause a full outage. An edge device failure can take out an entire site in one shot. On the storage side, a weight-fetching failure can stall recovery and present, from the outside, as a different kind of problem entirely. Add in the software layer, where a bad deploy or scheduler issue can propagate fast if nothing's there to catch it.
The symptom and the cause live in different layers, which is what makes debugging genuinely hard. A storage hiccup appears as a capacity problem. A thermal event appears as a quality problem. The signal you're chasing and the thing that's actually wrong are almost never the same thing. That's why generic infrastructure monitoring, built for stateless web services, misses so much in GPU environments.
That tension is visible directly in how health checks get designed. Passive checks (hardware telemetry, standard metrics) cost nothing in spare capacity, but they miss failures that only appear once a GPU is under real load. Active checks catch those, but only by actually loading the GPU, and a GPU already serving live traffic can't be used to run a synthetic health check at the same time. There's no way around that trade without spare capacity sitting somewhere.
Hardware choice affects reliability outcomes directly: data-center GPUs run ECC that catches errors consumer cards miss. Data-center GPUs like the H100 and H200 run ECC on HBM memory that's always on, built into the hardware, and catches single-bit errors before they turn into corrupted weights. Consumer cards in the RTX 4090 class lack the ECC memory that data-center GPUs provide. It's not the same guarantee. One is a background process baked into the silicon. The other is an optional setting most people never touch.
Node-level redundancy inside a single data center: what it takes to reach 99%
The job at this tier is narrow: catch a node before it degrades far enough to hurt a request. Detect it, drain it, replace it.
Kubernetes liveness probes check, on a loop, whether the inference server (vLLM, Triton, whatever's running) is actually responding over HTTP or gRPC. Readiness probes handle a different failure: they confirm a model is fully loaded into HBM before any traffic gets routed to it, which stops cold-start errors from ever reaching a user in the first place.
The more interesting piece is automatic cordon-and-drain. When a node throws a GPU Xid error (Xid 31, for instance, signals a memory page fault), the orchestration layer cordons it off, stops scheduling new pods onto it, and kicks off a replacement. GMI Cloud's Cluster Engine implements automatic cordon, drain, and node replacement along these lines.
Autoscaling matters here too, and for inference workloads the right scaling signal is queue depth rather than a generic utilization metric. Autoscaling tied to pending request queue depth reads the workload far more accurately than CPU utilization alone.
None of this is free. Everyone wants GPUs running close to full utilization, since idle GPU time is wasted money. But active health checks need spare capacity to run against, and that spare capacity is reliability bought with idle compute. Together AI's active checks fully load the GPU and can interfere with live workloads, so the company recommends running them during maintenance windows or against idle nodes specifically, while passive checks run against live traffic without consuming that spare capacity. That's the trade at the 99% tier in one sentence: reliability and utilization pulling in opposite directions.
Surviving a full data center failure: what it takes to reach 99.9%
Node-level redundancy stops helping once the failure domain is the whole facility. Power goes down, cooling fails, network ingress drops, and no amount of in-rack redundancy saves the request.
Three things have to be true simultaneously to survive that:
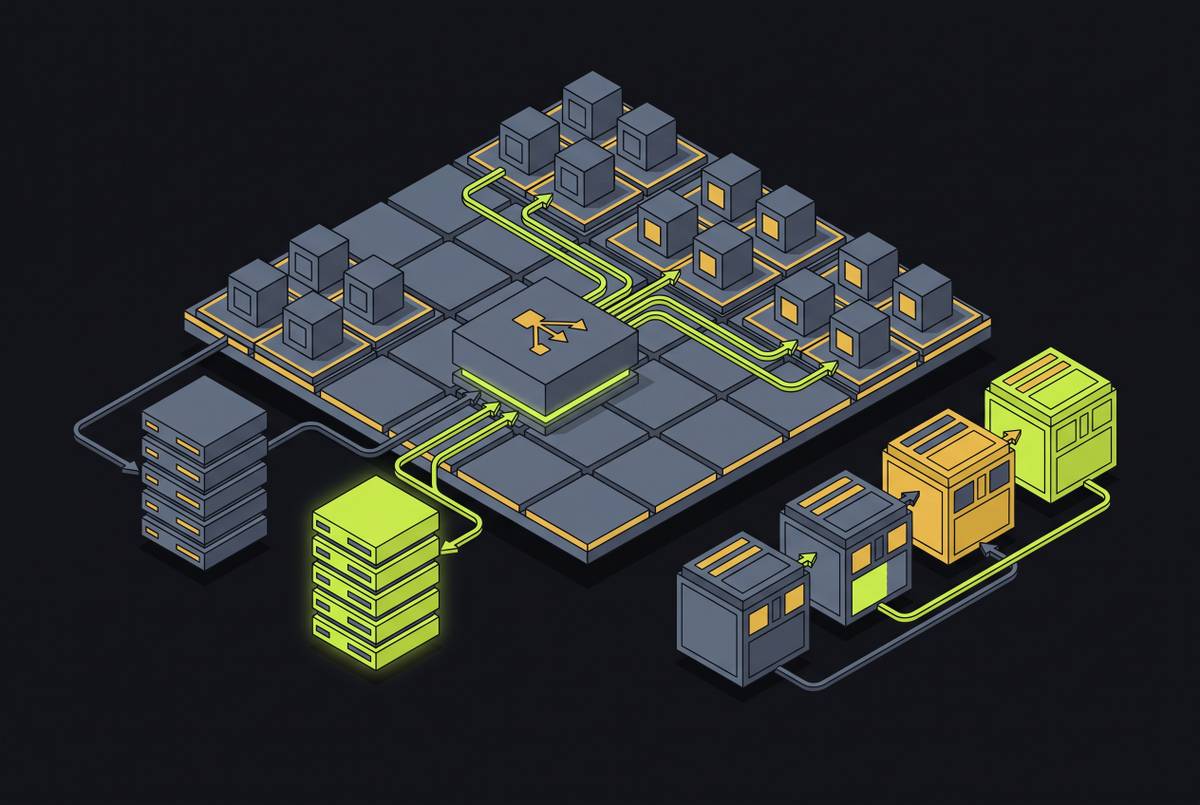
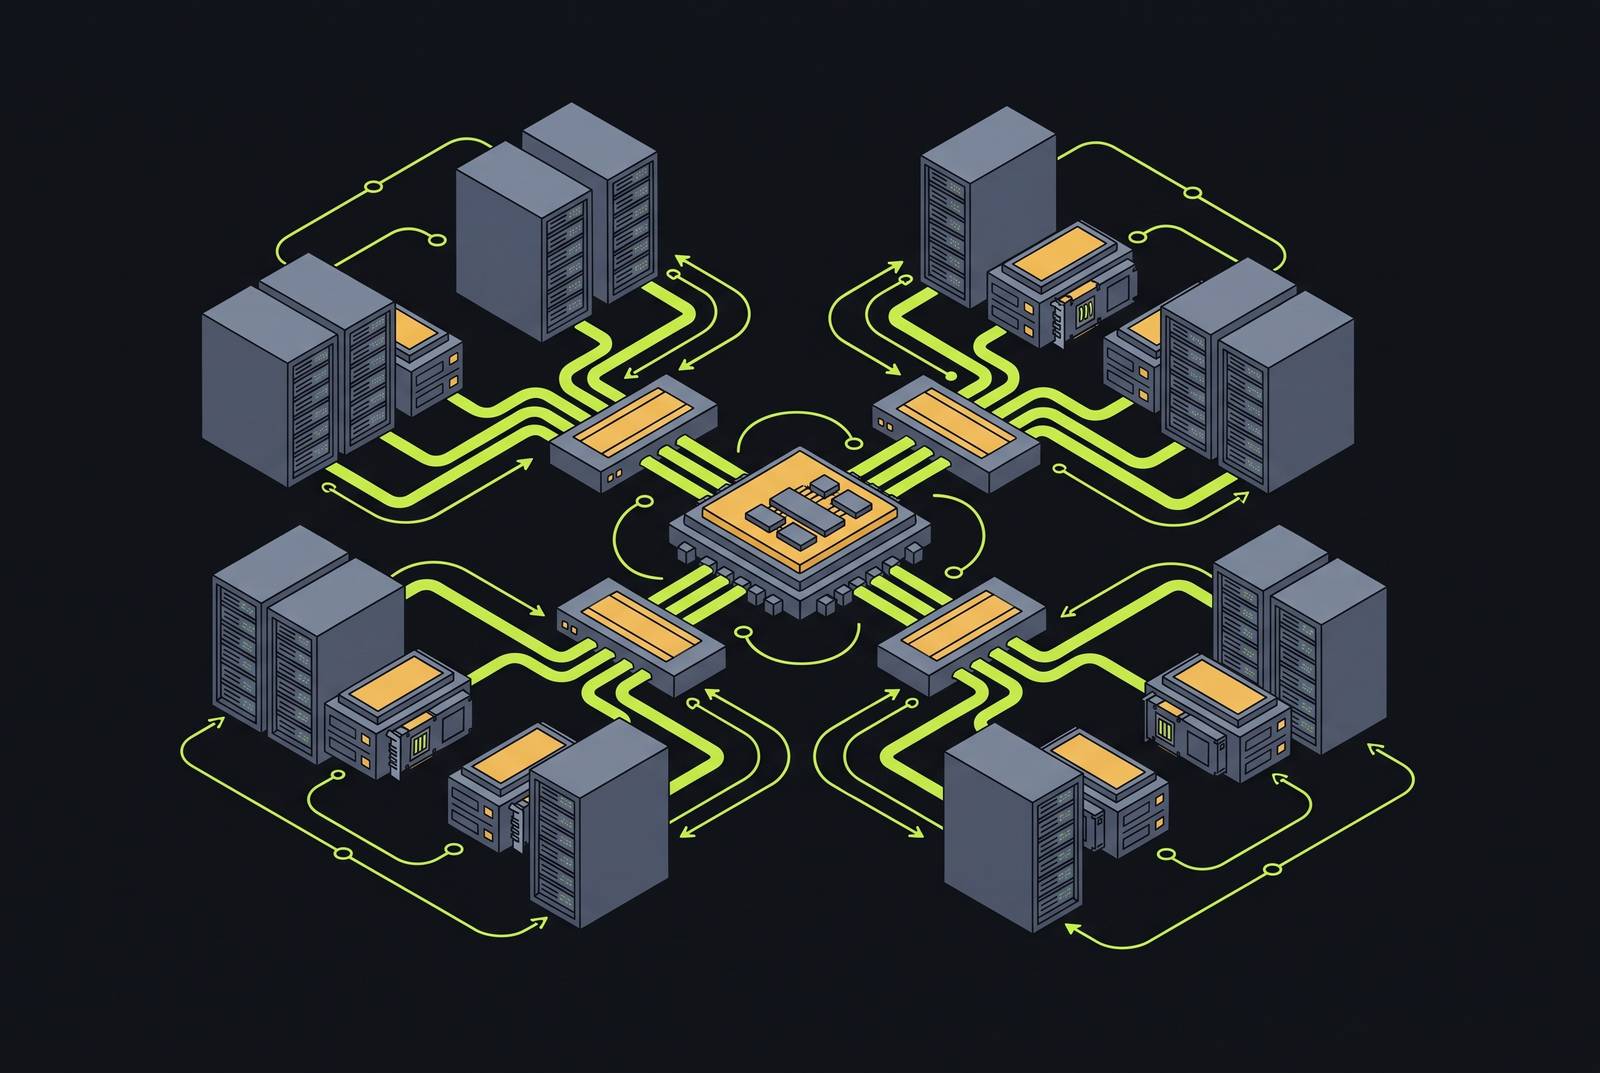
Model weights need to live in two separate facilities, not one with a backup copy sitting somewhere. Each facility needs enough spare capacity to absorb the entire load on its own if the other one disappears. That means real N capacity on each side, not a thin N+1 margin. And live traffic needs to be flowing to both facilities all the time, capable of routing there in practice, not just theoretically.
That last point is where a lot of "redundant" architectures quietly fail the definition. A failover facility that's sitting cold, that's never handled live production traffic, is a 99% system with a slower recovery path bolted on. It's a 99% system with a slower recovery path bolted on, and the difference only becomes visible during the incident itself, when the cold site has to spin up under pressure instead of just absorbing more load. Whether a provider runs live traffic to both sites at all times is the actual dividing line, more than anything in a spec sheet.
Ownership of the failure domain matters just as much. A provider renting capacity from a hyperscaler or a neocloud doesn't control the power, cooling, or network ingress layer underneath them. When one of those fails, the fix isn't in their hands, it's a support ticket filed with whoever does own it. Together AI has made this distinction part of its public positioning, pointing to visibility across its own footprint, chip to token, as the thing that collapses what would otherwise be a multi-hop support chain into a single point of contact.
Reserved capacity, multi-region, and the cost of idle: what it takes to reach 99.99%
At four nines, the failure domain widens to an entire cloud region. Availability-zone redundancy inside that region isn't enough on its own, because the whole region can go down together. The failover region has to be pre-provisioned and ready before anything breaks, not spun up in response.
The word that separates a real four-nines architecture from an aspirational one is "reserved." Not "traffic can be routed there if needed." Reserved means GPU capacity is sitting idle in that region right now, paid for, waiting. That's an economic commitment as much as an engineering one.
Reserved GPU capacity typically comes at a 30 to 50 percent discount off on-demand pricing, since the provider is trading flexibility for a guaranteed customer. But the capacity still costs money while it sits there doing nothing. That idle cost isn't waste to be trimmed down later, it's the actual price of four nines. Anyone optimizing it away is quietly giving up the reliability tier they're claiming to offer.
Multi-region also means more than copying weights to a second location and calling it done. The second region needs to be actively serving with those weights already loaded, so that a failover can shift 100 percent of traffic there without a cold load cycle standing between the outage and recovery.
How to measure whether your inference system is at the tier you think it is
Start with the definition of uptime itself, because two providers can both claim 99.99% while measuring completely different things. Uptime measured at the load balancer isn't the same as uptime measured at the GPU. Together AI's published methodology measures at inference completion, not at the gateway. A request that reaches the load balancer fine but fails once it hits the GPU still counts as downtime. A system that answers every request but returns garbage isn't up; it just looks up from far enough away. It just looks up from far enough away.
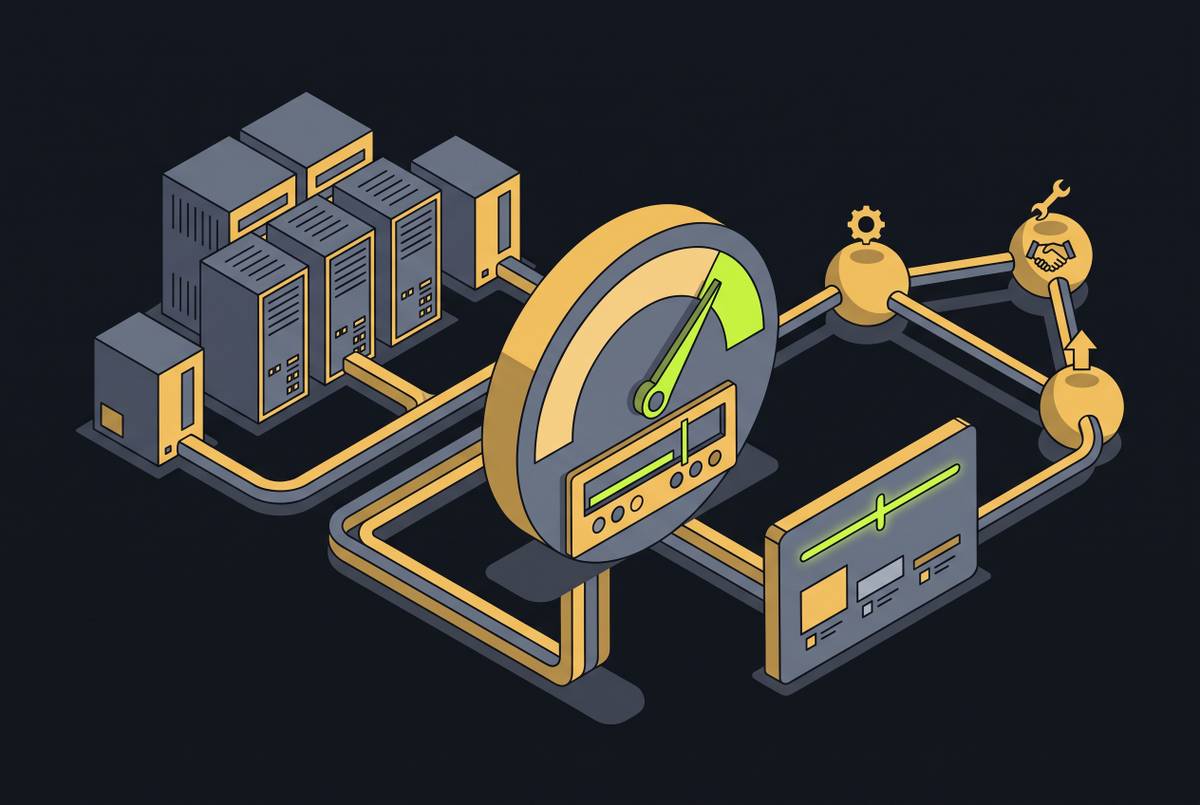
Latency consistency is a reliability signal. p50 latency is a baseline, nothing more. p95 is where inconsistency starts to show. p99 is where the real state of the system gets revealed. If p99 is far above p50, that's a sign of queuing or resource contention hiding under an average that still looks fine. That ratio tells you more in one number than a dashboard full of averages.
Testing under load reveals latency and failure behavior that demo testing hides. A provider showing low response times under light load can post numbers several times higher once real production concurrency hits. The only honest test is sustained load at target concurrency for 24 hours or more, with p50, p95, and p99 recorded across the whole run, not just sampled at the start.
Fallback activation rate should be tracked separately from HTTP success rate. If a system's fallback path, the route to a secondary model or a degraded mode, jumps sharply, say, up to 35%, that's an incident from the user's point of view even if every request still technically returns a 200. HTTP success alone will hide that completely.
Anywhere an external LLM API sits in the dependency chain, treat it like any other external dependency that can fail, slow down, throttle, or just change behavior without warning. A circuit breaker in front of it stops repeated calls to a struggling provider from dragging down the availability numbers of the system built on top of it.
The CI/CD and deployment pipeline changes that four-nines inference demands
Standard CI/CD tooling was built for software where correctness can be checked at compile time or with a test suite. Model quality doesn't work that way. An LLM endpoint can pass every integration test in the pipeline and still hallucinate at a noticeably higher rate the moment a new checkpoint goes live. That gap is the core problem four-nines inference has to design around.
Blue-green deployments handle model weight swaps by keeping two identical environments running and shifting traffic between them atomically, removing the risk that comes with upgrading a model in place. Canary releases work alongside that: a small slice of traffic goes to the new model version first, and p99 latency and fallback rate get watched closely before the rollout expands to everyone. GitOps keeps deployment state declared in version control, so a rollback is a git revert instead of someone manually undoing changes under pressure at 2am.
Infrastructure changes need the same care as model changes. GMI Cloud's Cluster Engine supports rolling updates for driver patches and OS upgrades, which is what keeps a routine maintenance window from turning into an availability incident on its own.
Tooling built specifically for this world is starting to catch up. Harness AI applies machine learning to test selection and deployment verification, so pipeline decisions respond to what actually changed rather than running the same blanket test suite every time. Datadog's Bits AI acts directly on observability data instead of just surfacing it in a dashboard, which matters at the serving layer where a human staring at graphs can't react fast enough. Security scanning at multiple points in the pipeline matters for CVE exposure sitting inside inference containers that often run for months without a rebuild.
None of these tools solve reliability by themselves. They exist to close the gap between what a test suite can verify and what actually breaks in production, which for GPU inference is a wider gap than most engineering teams are used to working with.
Sources
- How to Evaluate AI Inference Platforms for Enterprise Workloads in 2026 | GMI Cloud
- What does 99.9% uptime mean for inference?
- Which AI Inference Providers Are Reliable and Widely
- When GPUs Fail Quietly:Observability-Aware Early Warning Beyond Numeric Telemetry
- GPU Kubernetes Infrastructure Lab: Failure Modes in a Single-Node A10G Cluster | by Ibrahim Cisse | Medium
- gmicloud.ai