Alerting Architecture That Reduces On-Call Noise
Eliminate alert fatigue by fixing the architecture that creates it, not just tuning alerts.
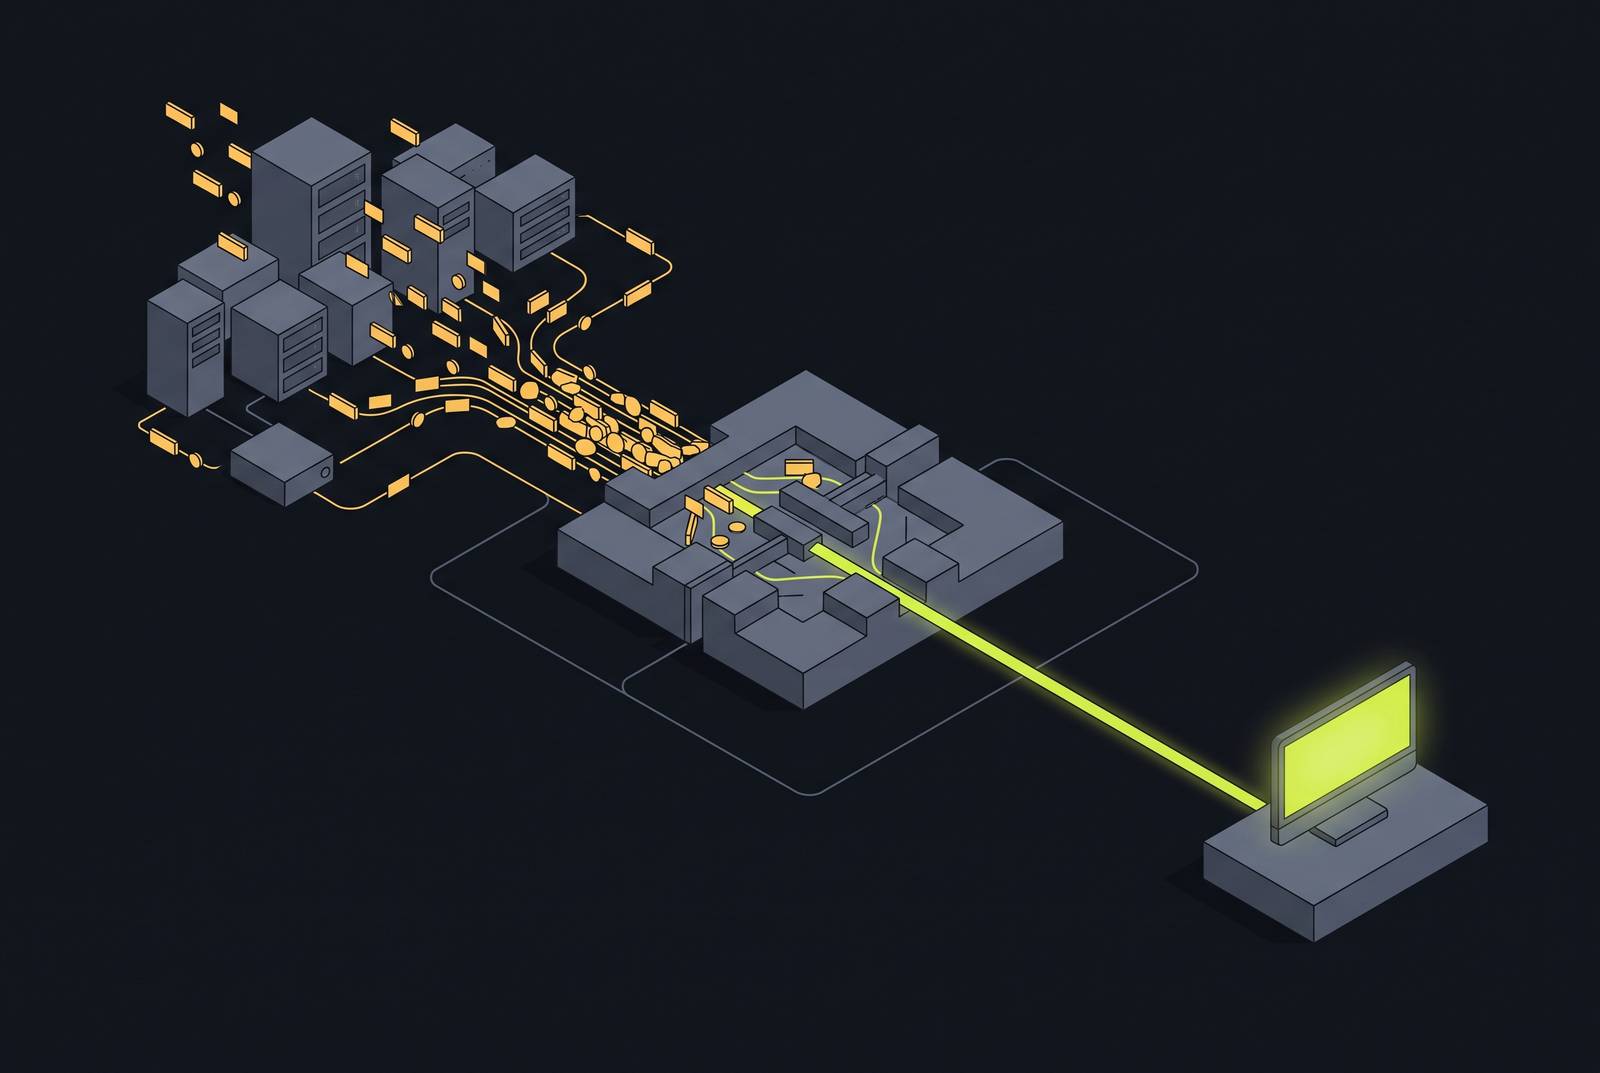
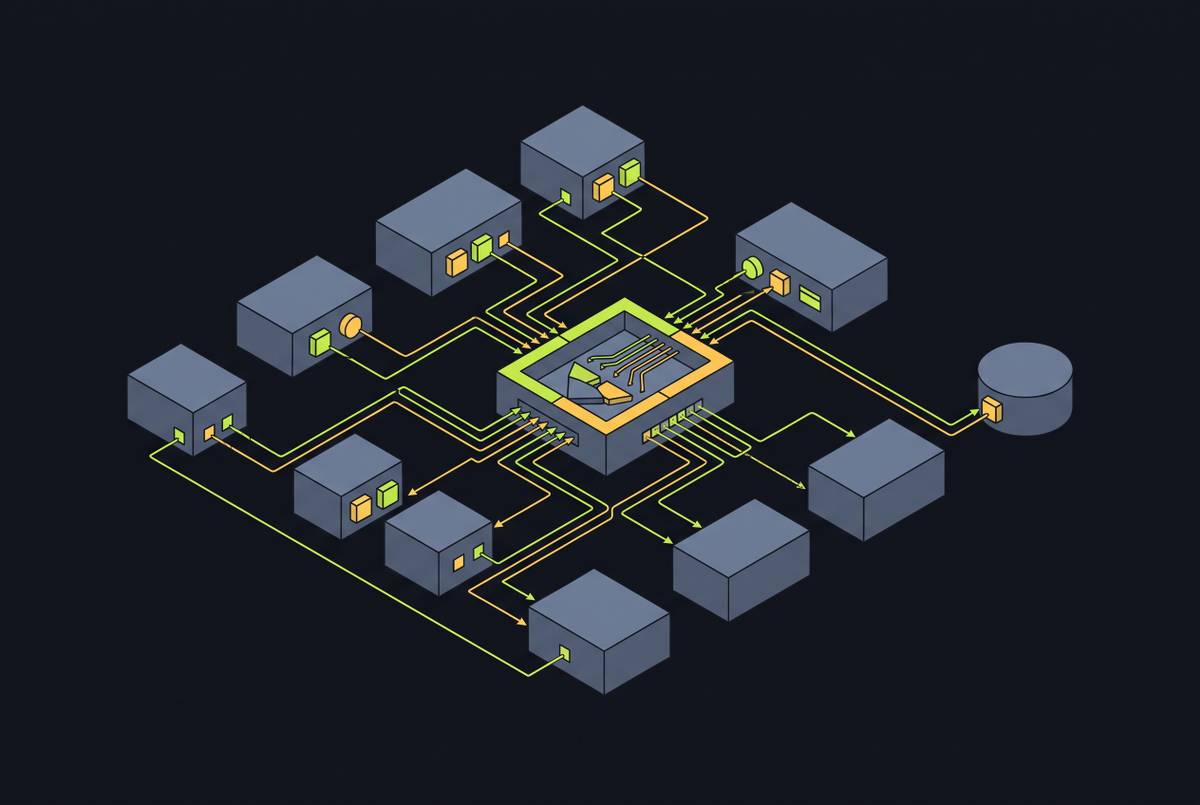
A large majority of SRE teams rank alert fatigue as a top-three operational concern. A 2026 survey of more than 1,000 SRE, DevOps, and IT operations professionals confirmed this. That's not a hypothetical edge case. Research from incident.io puts weekly alert volume in the thousands per team, with only about 3% requiring immediate action. PagerDuty's 2025 State of Digital Operations report similarly found that the average on-call engineer receives roughly 50 alerts per week, with only 2 to 5% requiring human intervention.
The cost of that ratio isn't just annoyance or a bad afternoon. NeuBird AI's 2026 report found that a significant share of organizations suffered an outage tied to a suppressed or ignored alert in the past year, and most had at least one incident where no alert fired. Both failures come from the same broken pipe. A 2024 Catchpoint study confirms this: a large majority of SRE teams rank alert fatigue among their top three concerns. But most teams are still tuning knobs on a system whose architecture guarantees they won't hold.
The structural conditions that produce noise in the first place
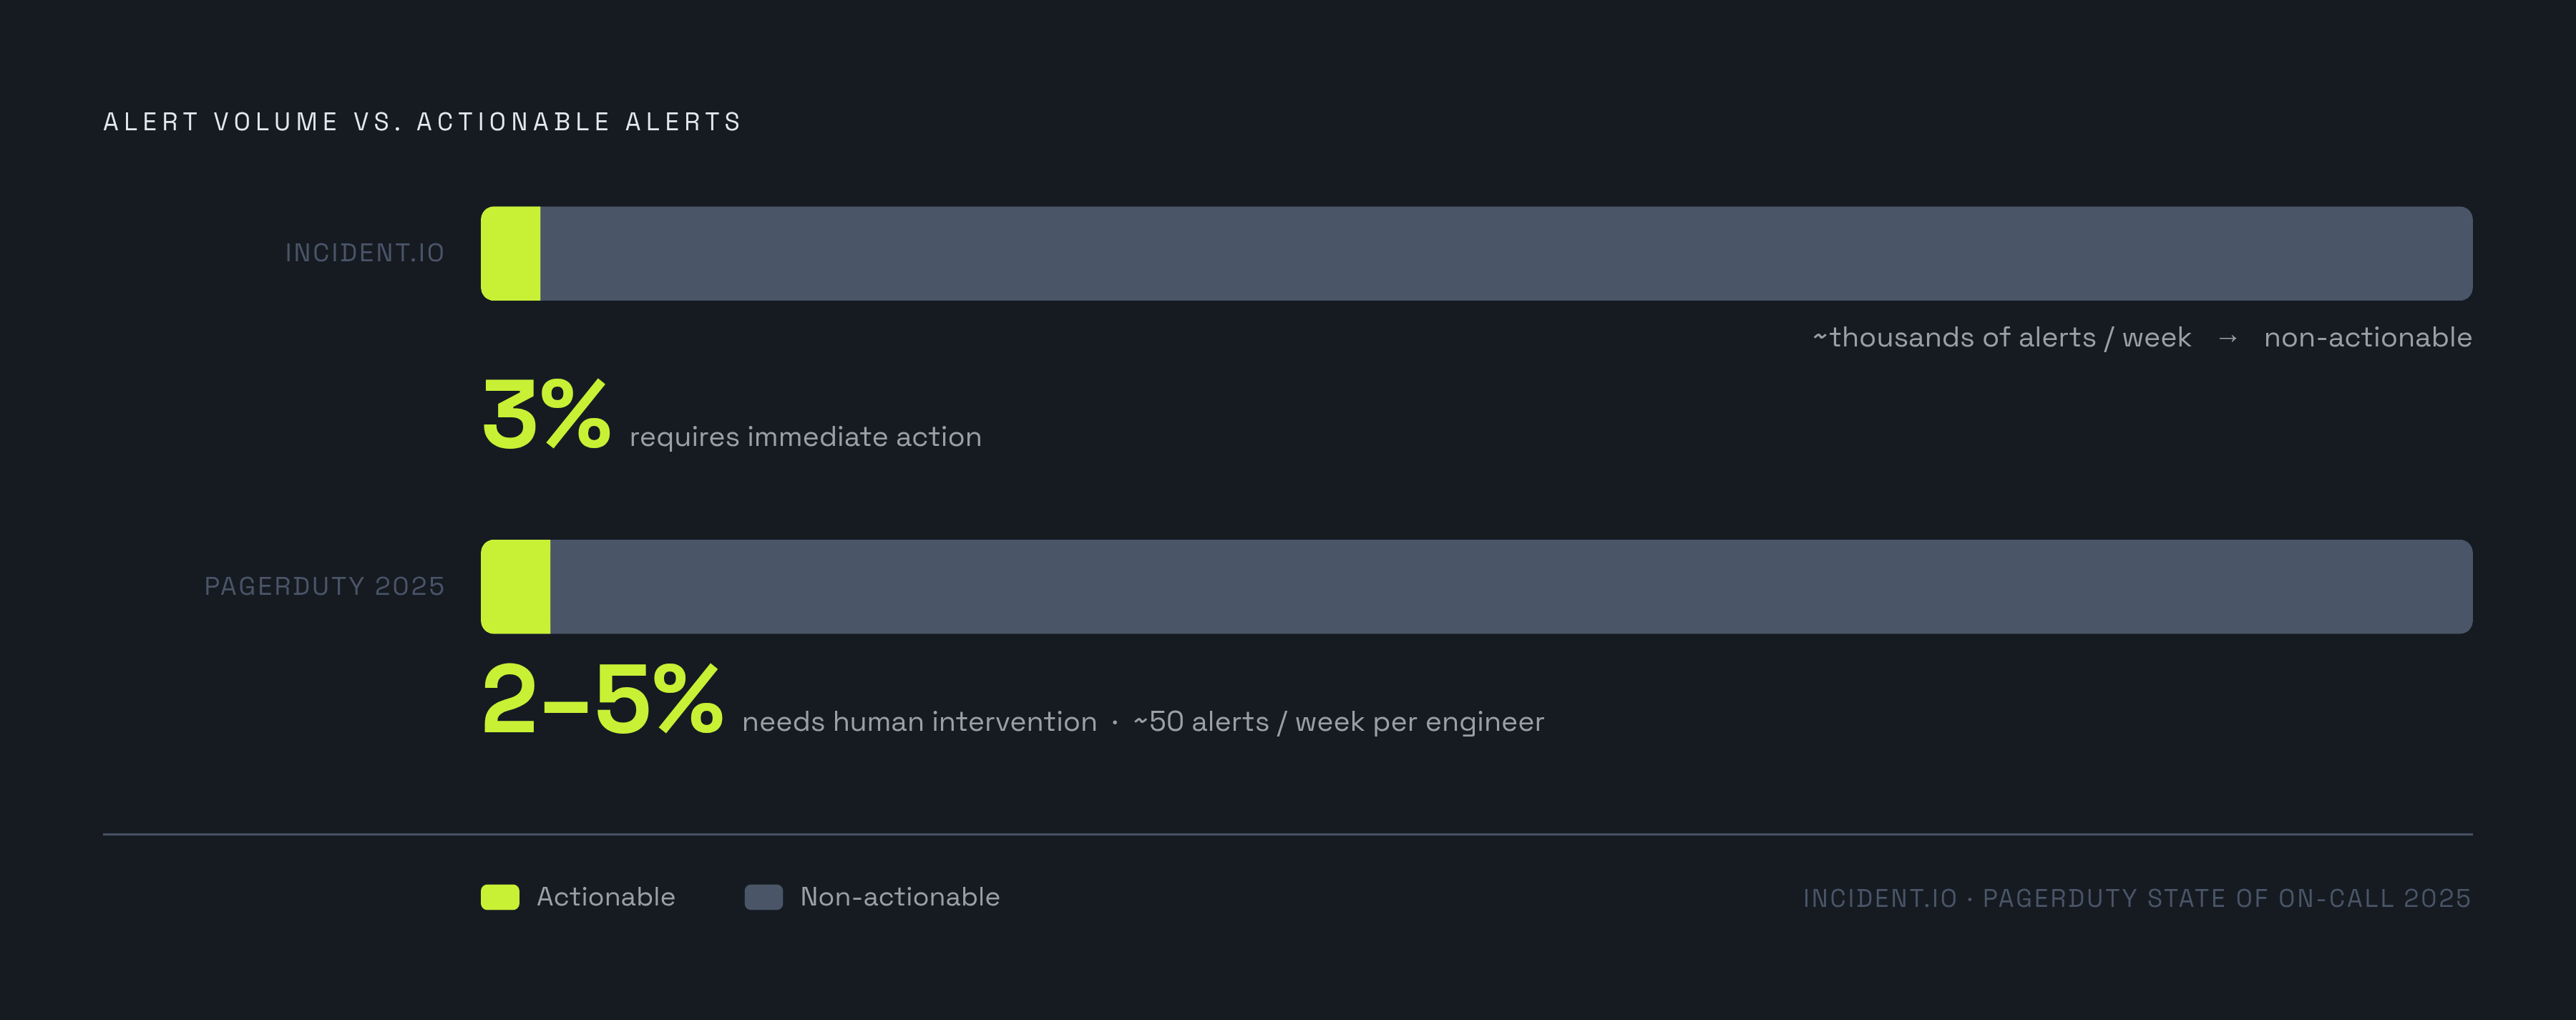
Alert fatigue isn't a personality flaw or a discipline problem among engineers. It's the predictable output of five structural conditions.
The first is over-monitoring: someone, at some point, decided that every metric, every log line, every warning state deserved its own alert rule. That decision felt responsible at the time. In practice it means a system produces the same volume of alerting when it's healthy as when it's on fire.
The second is a lack of prioritization: every alert carries equal urgency, so a dev-server disk warning looks identical to a production outage, and triage becomes guesswork.
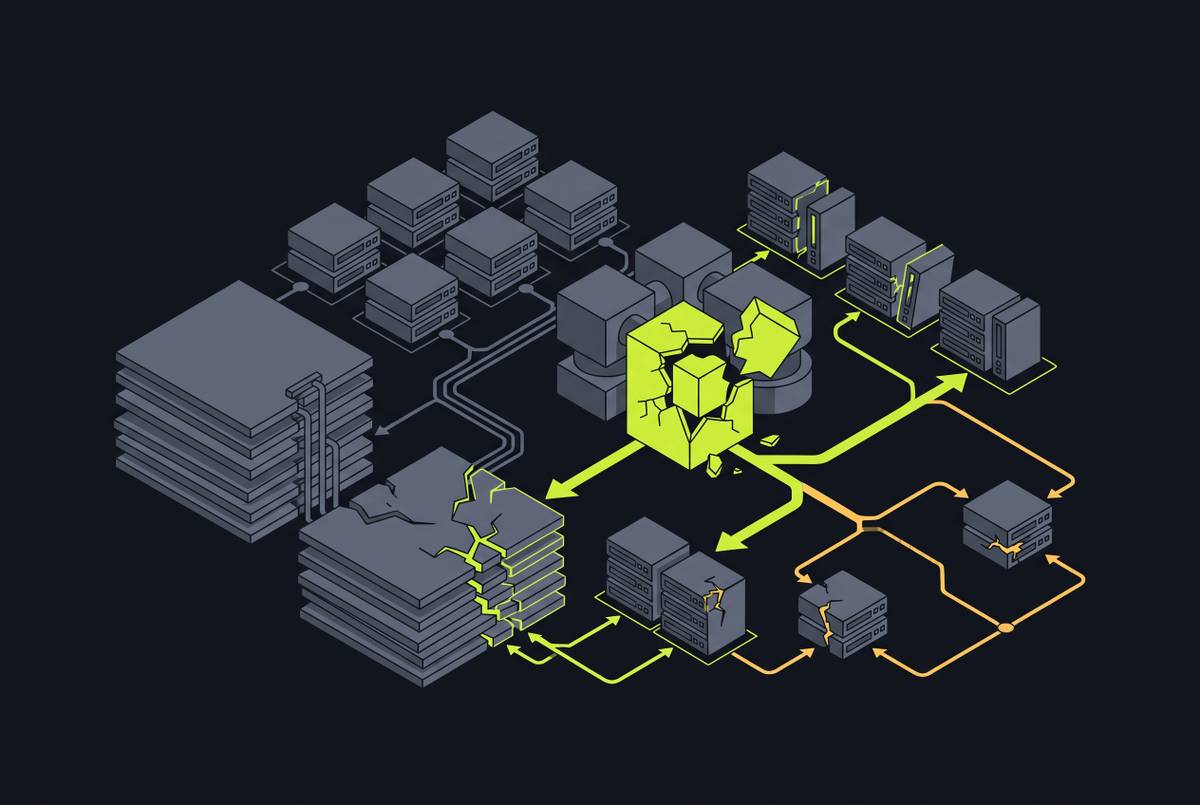
Third, and probably the most viscerally familiar to anyone who's carried a pager: alert storms. One upstream failure doesn't produce one alert. It produces a cascade, because every service and check downstream of that failure fires independently. A single broken database causes connection timeouts, HTTP 500 spikes, queue depth increases, health-check failures, and latency SLO breaches, and each of these effects fires as its own notification for that one underlying fault. Static thresholds worsen this: a CPU alert set at 80% can't distinguish a nightly batch job from a genuine failure, forcing manual exceptions every time infrastructure shifts.
Fourth: noisy integrations. Tools that forward or duplicate alerts without adding context multiply the volume without multiplying the value. And fifth, weak escalation policies mean alerts go to the wrong person, or to everyone, which is functionally the same as going to no one in particular.
OnPage's research shows these conditions produce two opposing failure modes: responders stop reacting from over-interruption, while a genuinely critical alert gets lost in the flood. Treating both as one problem with one fix tends to worsen each. Icinga's analysis of these five structural root causes shows that noise mechanically produces fatigue. That habit doesn't turn off the next time it matters.
The layered levers that compose a quiet alerting architecture
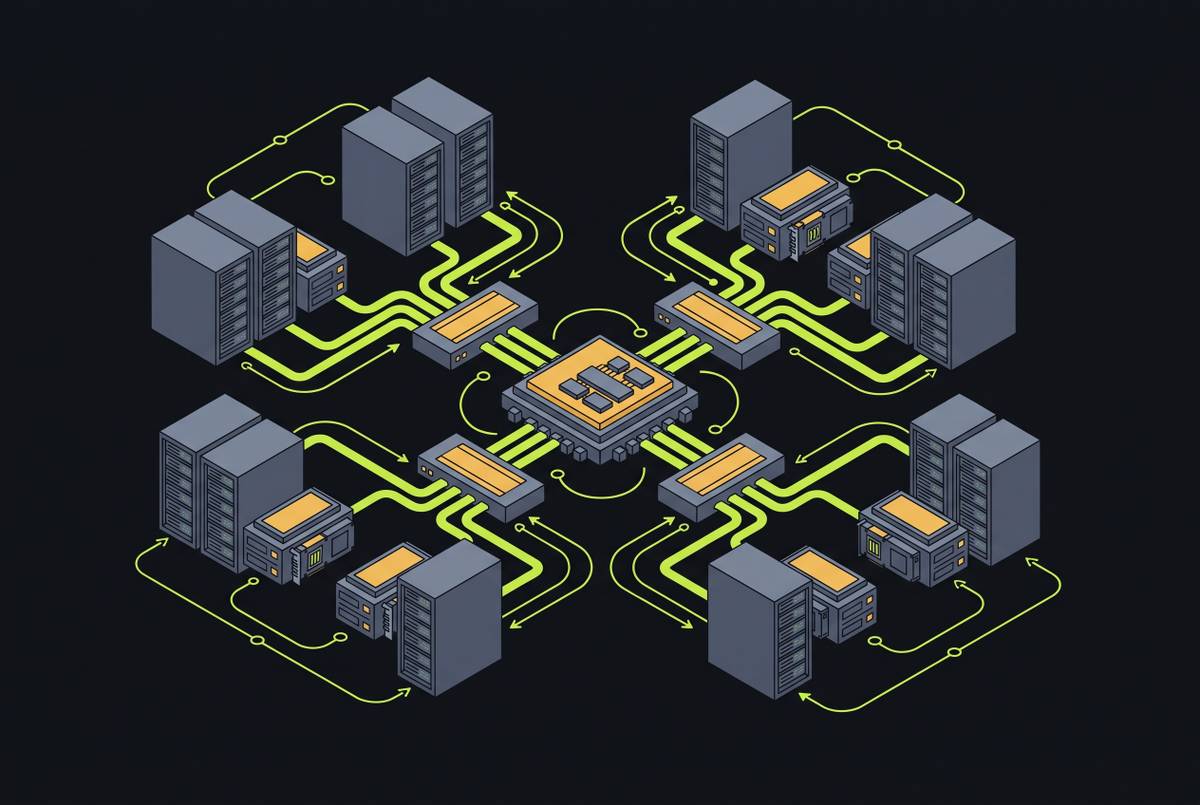
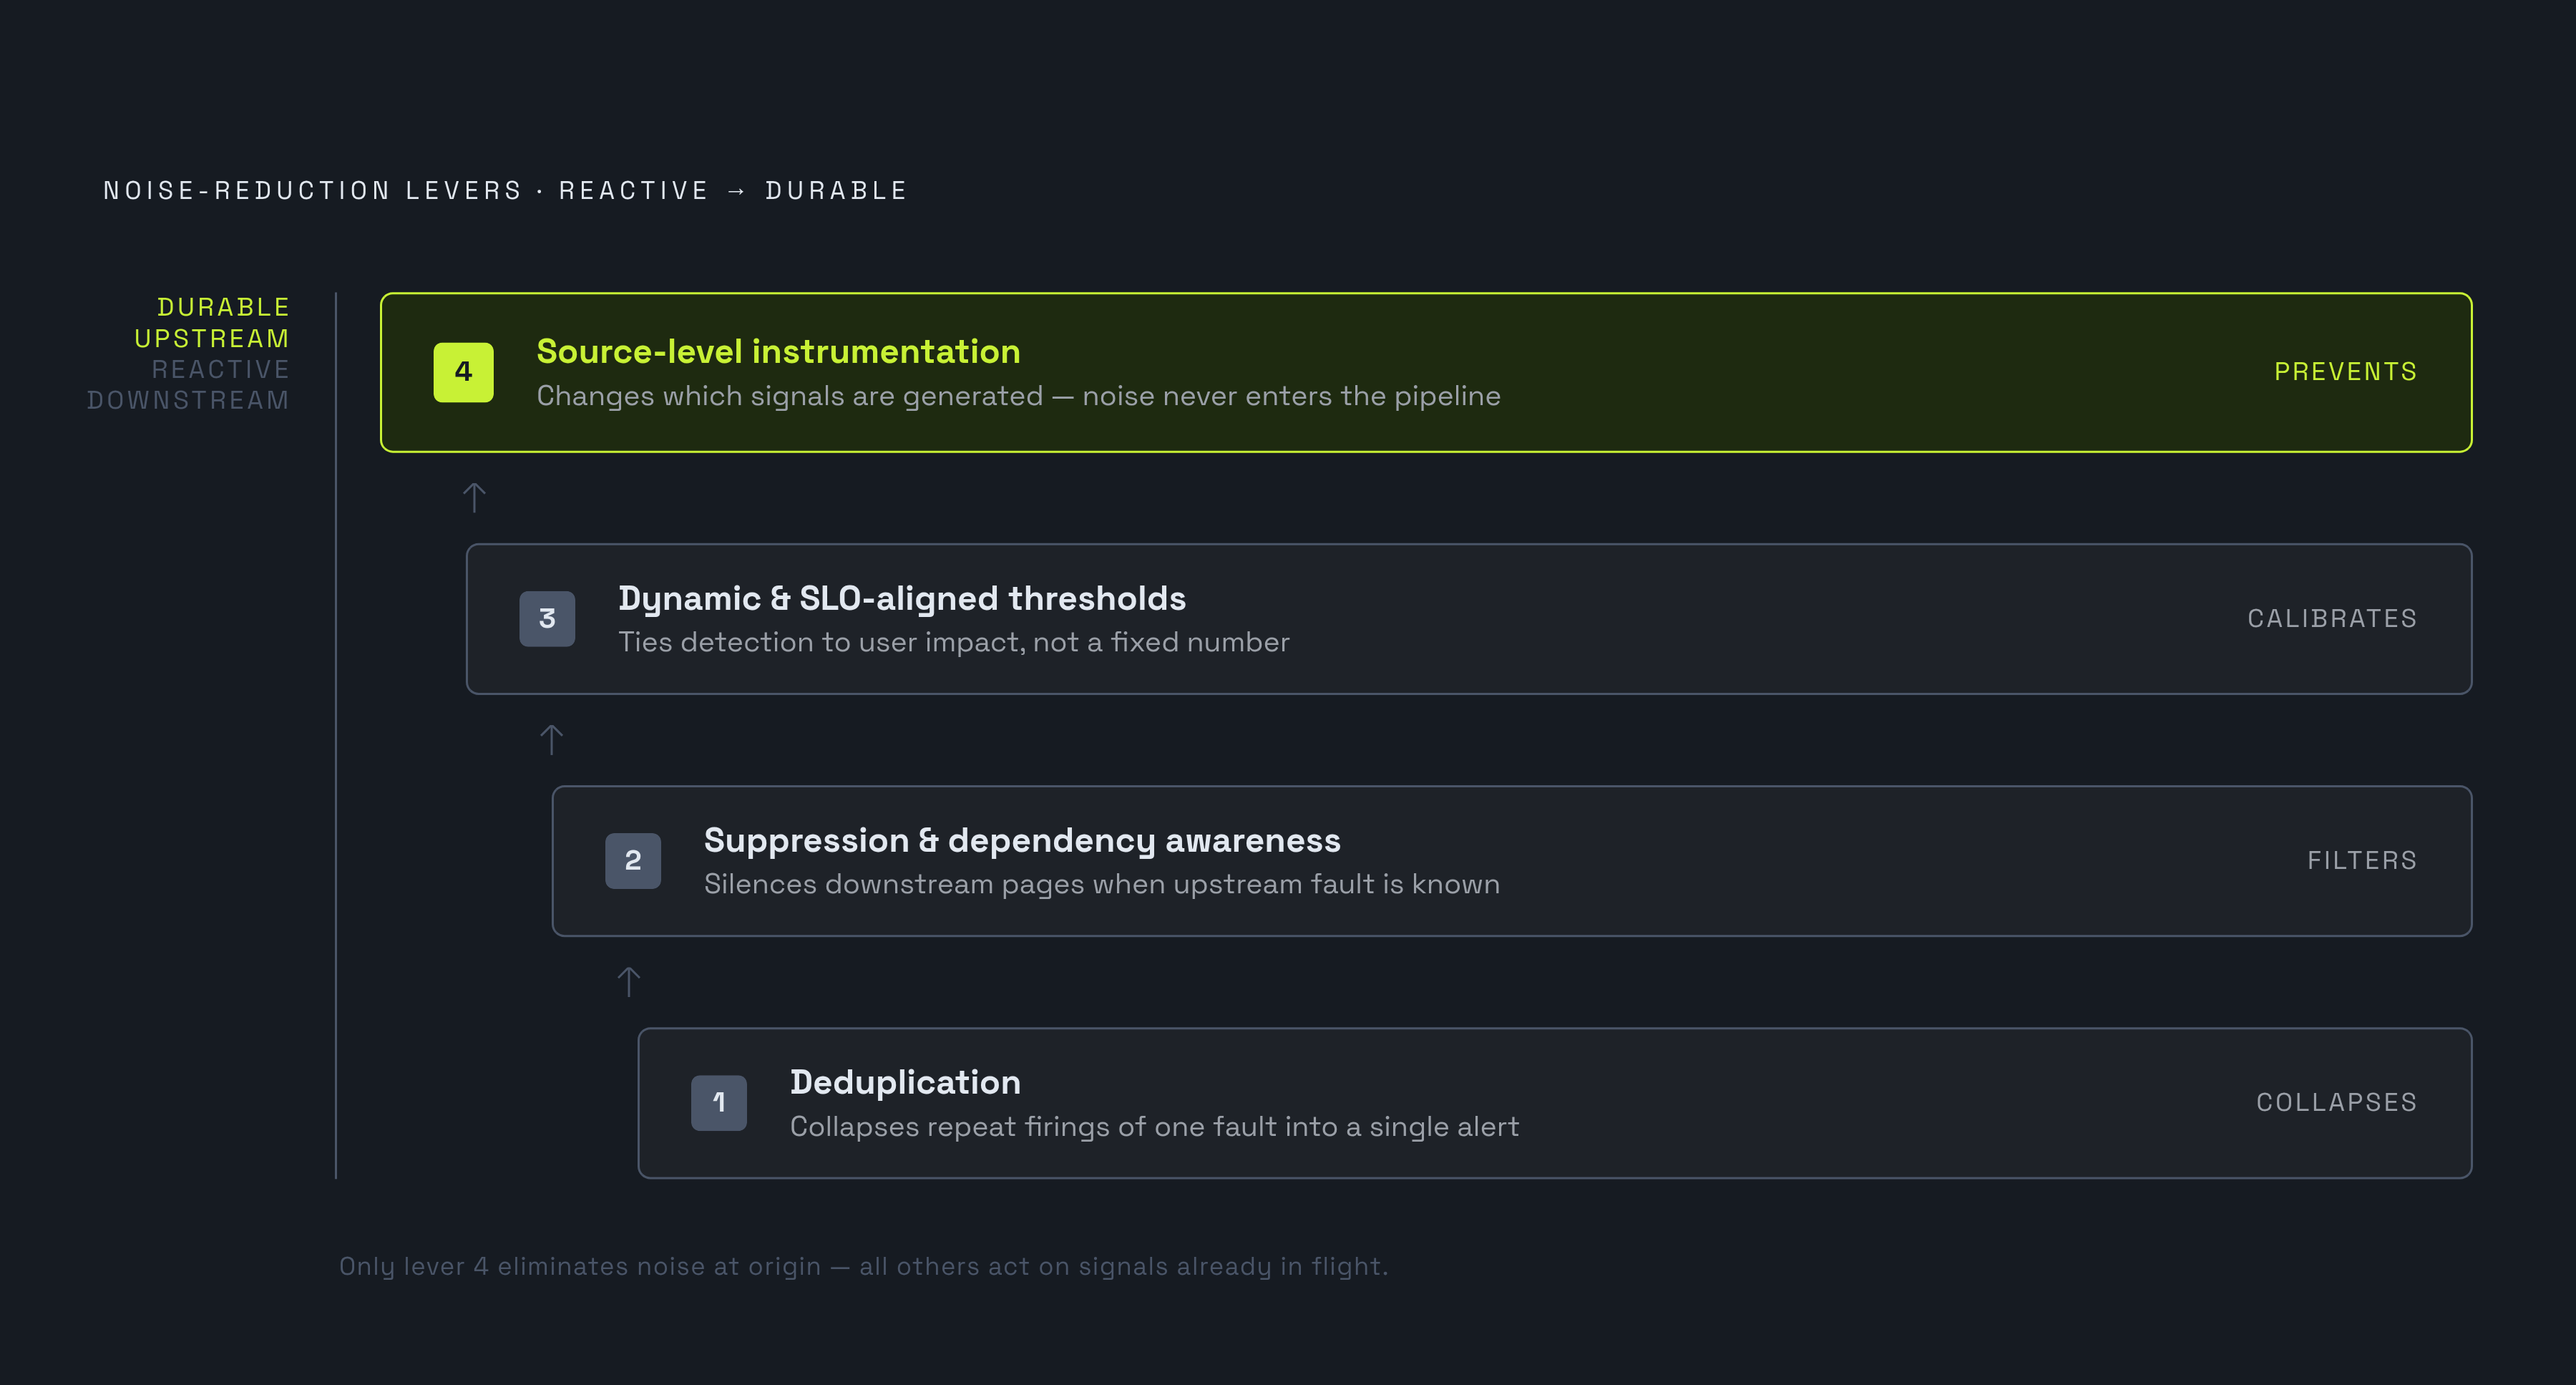
NeuBird AI states that cutting noise at scale requires a stack of complementary levers applied in order, from the pager back to the signal source. Each lever handles a different category of noise, and the reduction compounds as they stack.
The order matters, and it runs from downstream to upstream. Deduplication comes first, collapsing repeat firings of one fault into a single alert. Suppression and dependency awareness follow, silencing predictable downstream pages when an upstream fault is already known and being worked. Dynamic and SLO-aligned thresholds replace static trip-wires with detection tied to actual user impact rather than a fixed number. And at the top of the stack sits source-level instrumentation, which changes which signals get generated in the first place, so the noise never enters the pipeline.
The closer a lever operates to the source of the signal, the more durable its effect. Deduplication and grouping are pager hygiene: useful, necessary, but reactive. Source-level instrumentation is prevention. Before applying any of this, the honest starting point is a baseline count of alerts per week, per engineer, and the actionable share. Without that number, no claim of "we reduced noise" means anything.
Deduplication and suppression: when to use each
Start with the rule that keeps these two controls from getting tangled together. Use suppression for known events. Use deduplication for redundant recurrence. Conflating them causes coverage gaps from over-suppressing, or leftover noise from under-deduplicating.
Suppression silences alerts that are anticipated, tied to something scheduled, like a maintenance window on a specific set of services. It exists for events the team already knows about ahead of time. Deduplication handles the opposite case: unscheduled alerts that repeat as matching copies within a defined time window. A flapping interface or a health check failing every few seconds shouldn't page dozens of times; deduplication makes it page once instead.
OnPage's split yields a useful taxonomy: over-interrupted responders versus a critical alert lost in the flood, and treating both as one problem worsens each. Repeated copies of the same event, like a disk threshold or a flapping interface firing every few seconds, are a deduplication candidate. Expected activity during planned work, like a scheduled deployment or a database migration, is a suppression candidate. And incidents already owned by another responder call for auto-mute on acknowledgment, so the same page doesn't blast out to the entire team after someone's already picked it up.
Suppression carries a real cost: maintenance windows left uncleared create blind spots. This is likely the mechanism behind the "no alert fired" pattern in the NeuBird data. A suppression rule left running past its window quiets everything, including the alert that mattered.
Dependency-aware alert routing: why upstream failures should silence their own children
Deduplication catches identical repeats but not cascades, since each alert in a storm is technically distinct, and a timeout here, a 500 spike there, and a queue backing up elsewhere all fire separately. All different alerts, all downstream of the same broken database. Without dependency awareness, one upstream outage produces an accurate alert storm from every service it touches. None of them, on their own, are actionable, because none of them say where the actual problem lives.
The fix ties checks to their parent service, so only the root cause triggers critically while child failures stay suppressed or downgraded during the parent's known-bad state. Icinga's business process modeling groups technical checks into business-relevant structures, surfacing real user impact instead of raw infrastructure state.
Building that map by hand doesn't scale, and it goes stale the moment a new microservice ships. OpenTelemetry solves this without manual diagramming: its Collector's service graph connector emits service-relationship metrics from trace data, letting correlation logic trace downstream alerts back to one layer automatically.
Temporal correlation, grouping alerts by time window, catches some of this but produces false groupings since unrelated things often break simultaneously. Adding the dependency graph as a second dimension sharpens that grouping considerably.
Symptom-based alert design: why infrastructure metrics make poor pages
Everything above deals with routing and grouping. None of it fixes a signal that should never have existed. oneuptime.com ties the core principle to user impact: CPU at 80% means nothing if users are happy, so alerts should describe user pain, not infrastructure state.
Over-interrupted responders stop reacting, while a critical alert gets lost in the flood, and treating both as one problem worsens each. Infrastructure state looks like high CPU, climbing memory, a nearly full disk, a restarted pod. Users have never once complained about CPU utilization. They complain about a page that won't load, a cart that won't check out, a payment that silently failed. A symptom-based alert names that experience directly, making it self-evidently actionable. A cause-based alert requires a diagnosis step before anyone knows whether to act, and that delay turns a small problem into a long outage.
Every alert needs a named owner, a structural rule underlying this. An alert with no owner becomes noise by default, no matter how carefully the threshold was chosen. The design loop from oneuptime.com: define user impact, choose the signal, set thresholds from historical data, add context and a runbook, test in staging, monitor performance, and tune or remove it if it stops being actionable.
Thresholds themselves vary by metric type, and the differences matter. Latency thresholds work best at roughly twice the P95 baseline, from historical data rather than guesswork. Error rate thresholds should start low and get tuned against the SLO over time. Saturation alerts must fire well before the ceiling, leaving reaction time before failure. Availability thresholds should derive from the SLO target, not an arbitrary round number. Examples of user impact: API latency P95 over 500ms, elevated checkout error rate, rising database query timeouts, and payment success rate below SLO.
SLO burn rate alerting as the replacement for static thresholds
The batch job clearly illustrates why static thresholds fail structurally, not just occasionally. A CPU alert set at 80% can't distinguish an intentional nightly spike from an accidental failure spike. Both look identical to the rule.
SLO burn rate alerting discards the question a static threshold asks. Instead of "is this metric above a number," it asks "are we burning error budget faster than sustainablec23." This reframe matters because a page then reflects genuine user impact against a real SLO window, not an arbitrary dashboard line.
Multi-window burn rate alerts catch two distinct failure shapes at once. A fast burn, where budget vanishes many times faster than sustainable in a short window, triggers an immediate critical page.
None of this works without picking the right SLOs first. sandeepkumarchaudhary.com recommends the practical start: a small number of meaningful SLOs built around real user journeys, not vanity dashboards nobody opens. For teams on Prometheus, oneuptime.com's PromQL pattern for multi-window SLO burn rate alerts is a solid implementation to build from. Static thresholds also weight all responses equally, so a single bad request in a million can trigger a page. SLO burn rate alerting reframes this to "are we consuming error budget faster than sustainable?", so a page reflects real user impact on a real SLO window.
# Fast burn: 14x budget consumption over 1h, confirmed over 5m
(
 sum(rate(http_requests_total{status=~"5.."}[1h]))
 /
 sum(rate(http_requests_total[1h]))
) > (14 * 0.001)
and
(
 sum(rate(http_requests_total{status=~"5.."}[5m]))
 /
 sum(rate(http_requests_total[5m]))
) > (14 * 0.001)
The structural win: normal variation within the error budget never triggers a page, without hand-written exceptions. The SLO does that filtering on its own.
Source-level instrumentation as the most durable noise reduction
Everything covered so far (deduplication, suppression, dependency routing, SLO thresholds) operates downstream of the signal. It filters a stream that was noisy to begin with. That works until the environment changes (a new service ships, a dependency swaps out) and the filtering rules go stale.
NeuBird AI states that the more durable approach fixes the signal at the source, so fewer low-value signals get created and the reduction needn't be reapplied as the system evolves. The root issue: generic auto-instrumentation treats every route and endpoint as equally worth watching. A health-check endpoint that nobody cares about generates just as much signal as the checkout flow that pays the bills. The fix is to instrument around business risk (critical user journeys, revenue paths, the SLOs that matter) rather than accept a framework's defaults. Agentic instrumentation extends this by generating high-signal alerts upstream to determine what reaches the pipeline, instead of filtering downstream after the fact.
The cold-start case
Serverless environments have their own version of this problem, and it's specific enough to walk through on its own. Cold starts during traffic surges cause transient timeouts identical to real regressions, masking genuine failures behind noise that resolves in seconds.
Tag every invocation that experienced a cold start with a runtime marker. Apply a short suppression window to 5xx errors only when correlated with that cold-start marker. The step teams skip, and the one that matters most: suppress only the noise you understand, and let everything else through. aiopsschool.com's pattern: tag cold-start invocations with a runtime marker, suppress cold-start–correlated 5xx briefly, and route non-cold-start 5xx directly to on-call unfiltered.
Alert severity hierarchy and the context that makes a page actionable at 3 AM
A well-designed signal can still fail if it lands in the wrong bucket. Severity isn't a cosmetic label. It determines who gets interrupted and how fast, so getting it wrong undoes a lot of the work done upstream.
Critical alerts page immediately with a five-minute response expectation, reserved for user-facing outages, data-loss risk, or security breaches. Warning-level alerts page during business hours with a thirty-minute window, covering degraded performance, approaching capacity limits, or fast but non-catastrophic error budget burn. Informational signals (capacity data, non-critical job failures, configuration drift) belong on a dashboard or ticket queue for the next business day. They have no business paging anyone.
The blunt operating rule: only critical alerts interrupt sleep. Everything else routes to a dashboard or a queue, where it waits for someone with daylight and coffee. Severity done right isn't about sorting alerts into neater piles.
Sources
- How to Build Alert Rule Design
- Alert Fatigue in Monitoring: How to Cut Noise, Reduce Burnout, and Regain Control
- How to Cut Alert Noise by 90 Percent for On-Call Teams | NeuBird AI
- How OnPage Eliminates Alert Noise for IT Ops Teams in 2026 - OnPage
- What is noise reduction? Meaning, Architecture, Examples, Use Cases, and How to Measure It (2026 Guide) – AiOps School
- Alert fatigue solutions for DevOps teams in 2025: What works | Blog | incident.io
- Monitoring and Alerting Best Practices to Reduce Alert Fatigue
- Alert Deduplication: Reduce Duplicate Alerts | OnPage