GPU Workload Monitoring and Failure Detection for AI Inference
Silent GPU failures keep inference endpoints running while serving wrong outputs to users.
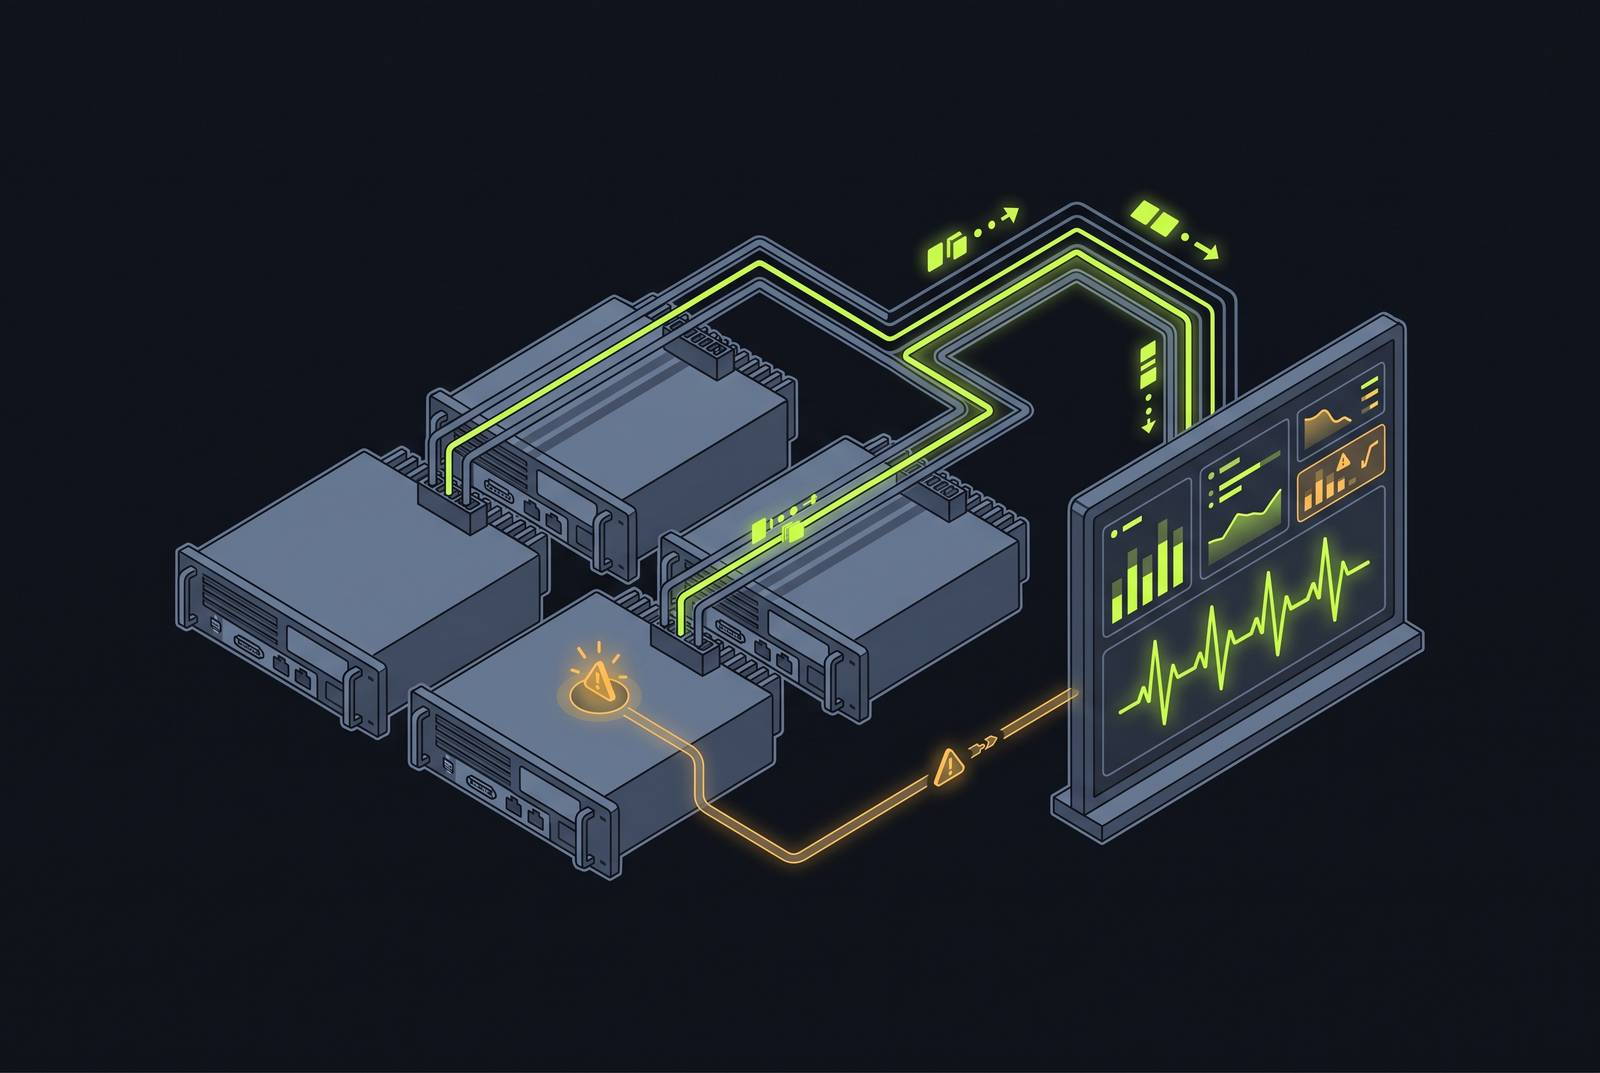
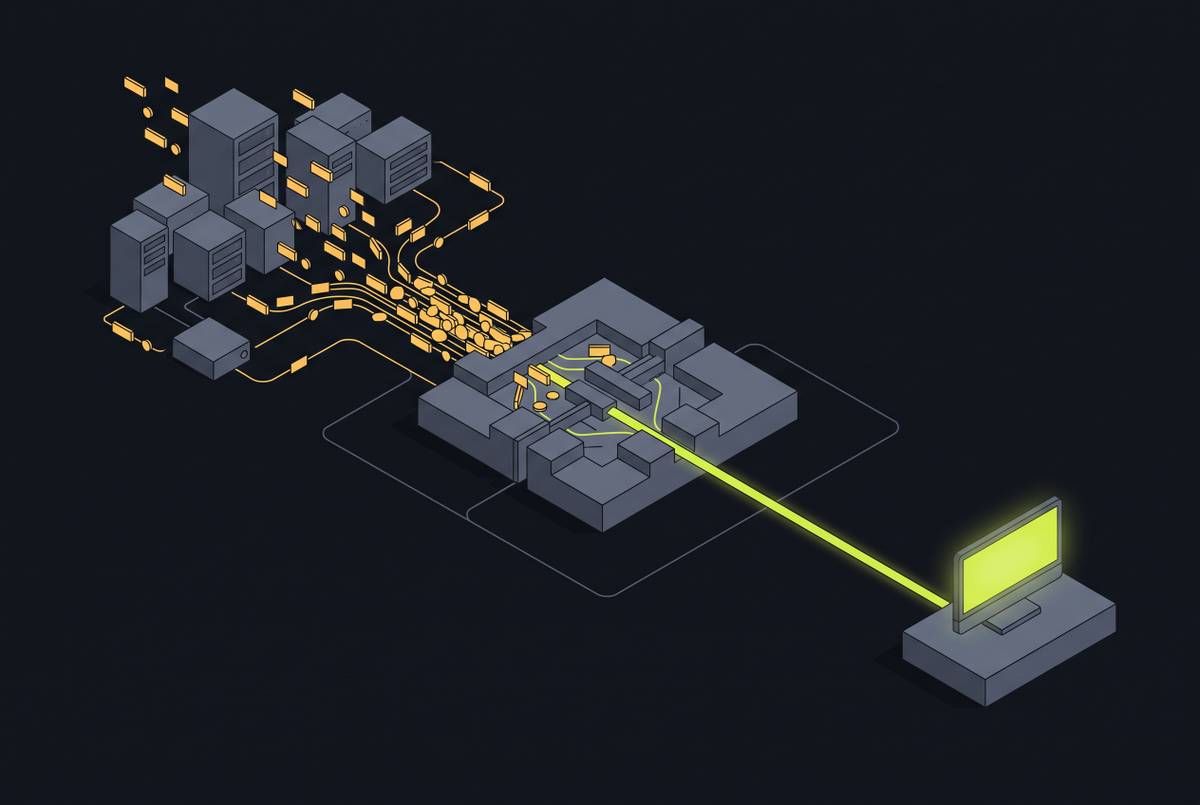
Inference now takes up more AI GPU spend than training does, so the failures that actually matter have shifted too. A training job that crashes is loud: the process dies, the run stops, a checkpoint goes missing, and the absence of output tells you something broke. An inference endpoint that's failing usually keeps running. Latency creeps up and output quality slips, but nothing crashes and nothing fires an alert. The gap between a pod reporting healthy and a service actually working well is the central problem inference infrastructure has to solve.
Research from GWDG on GPU observability names a failure type that shows this clearly: "detachment-class" events, where a GPU falls off the bus. Temperature, power draw, clock speed, and utilization all read normal right up to the moment the device vanishes from telemetry. Alerting that only fires when a value crosses a threshold has nothing to catch, because nothing crossed anything. A device just stopped reporting.
Hardware faults carry the same blind spot. A double-bit ECC memory error, logged as XID 48, can leave the host OS and the Kubernetes node both reporting healthy while the GPU underneath quietly returns wrong results. Standard liveness and readiness probes keep the container marked as running the entire time.
Research on TSGuard, evaluated against Microsoft Azure production data, found that the standard incident workflow puts the infrastructure provider in charge of manual troubleshooting, and resolving an incident this way often takes several days. A multi-day wait is survivable for a training run sitting at a checkpoint. For an inference endpoint serving live traffic, it's an outage.
The failure taxonomy inference teams face
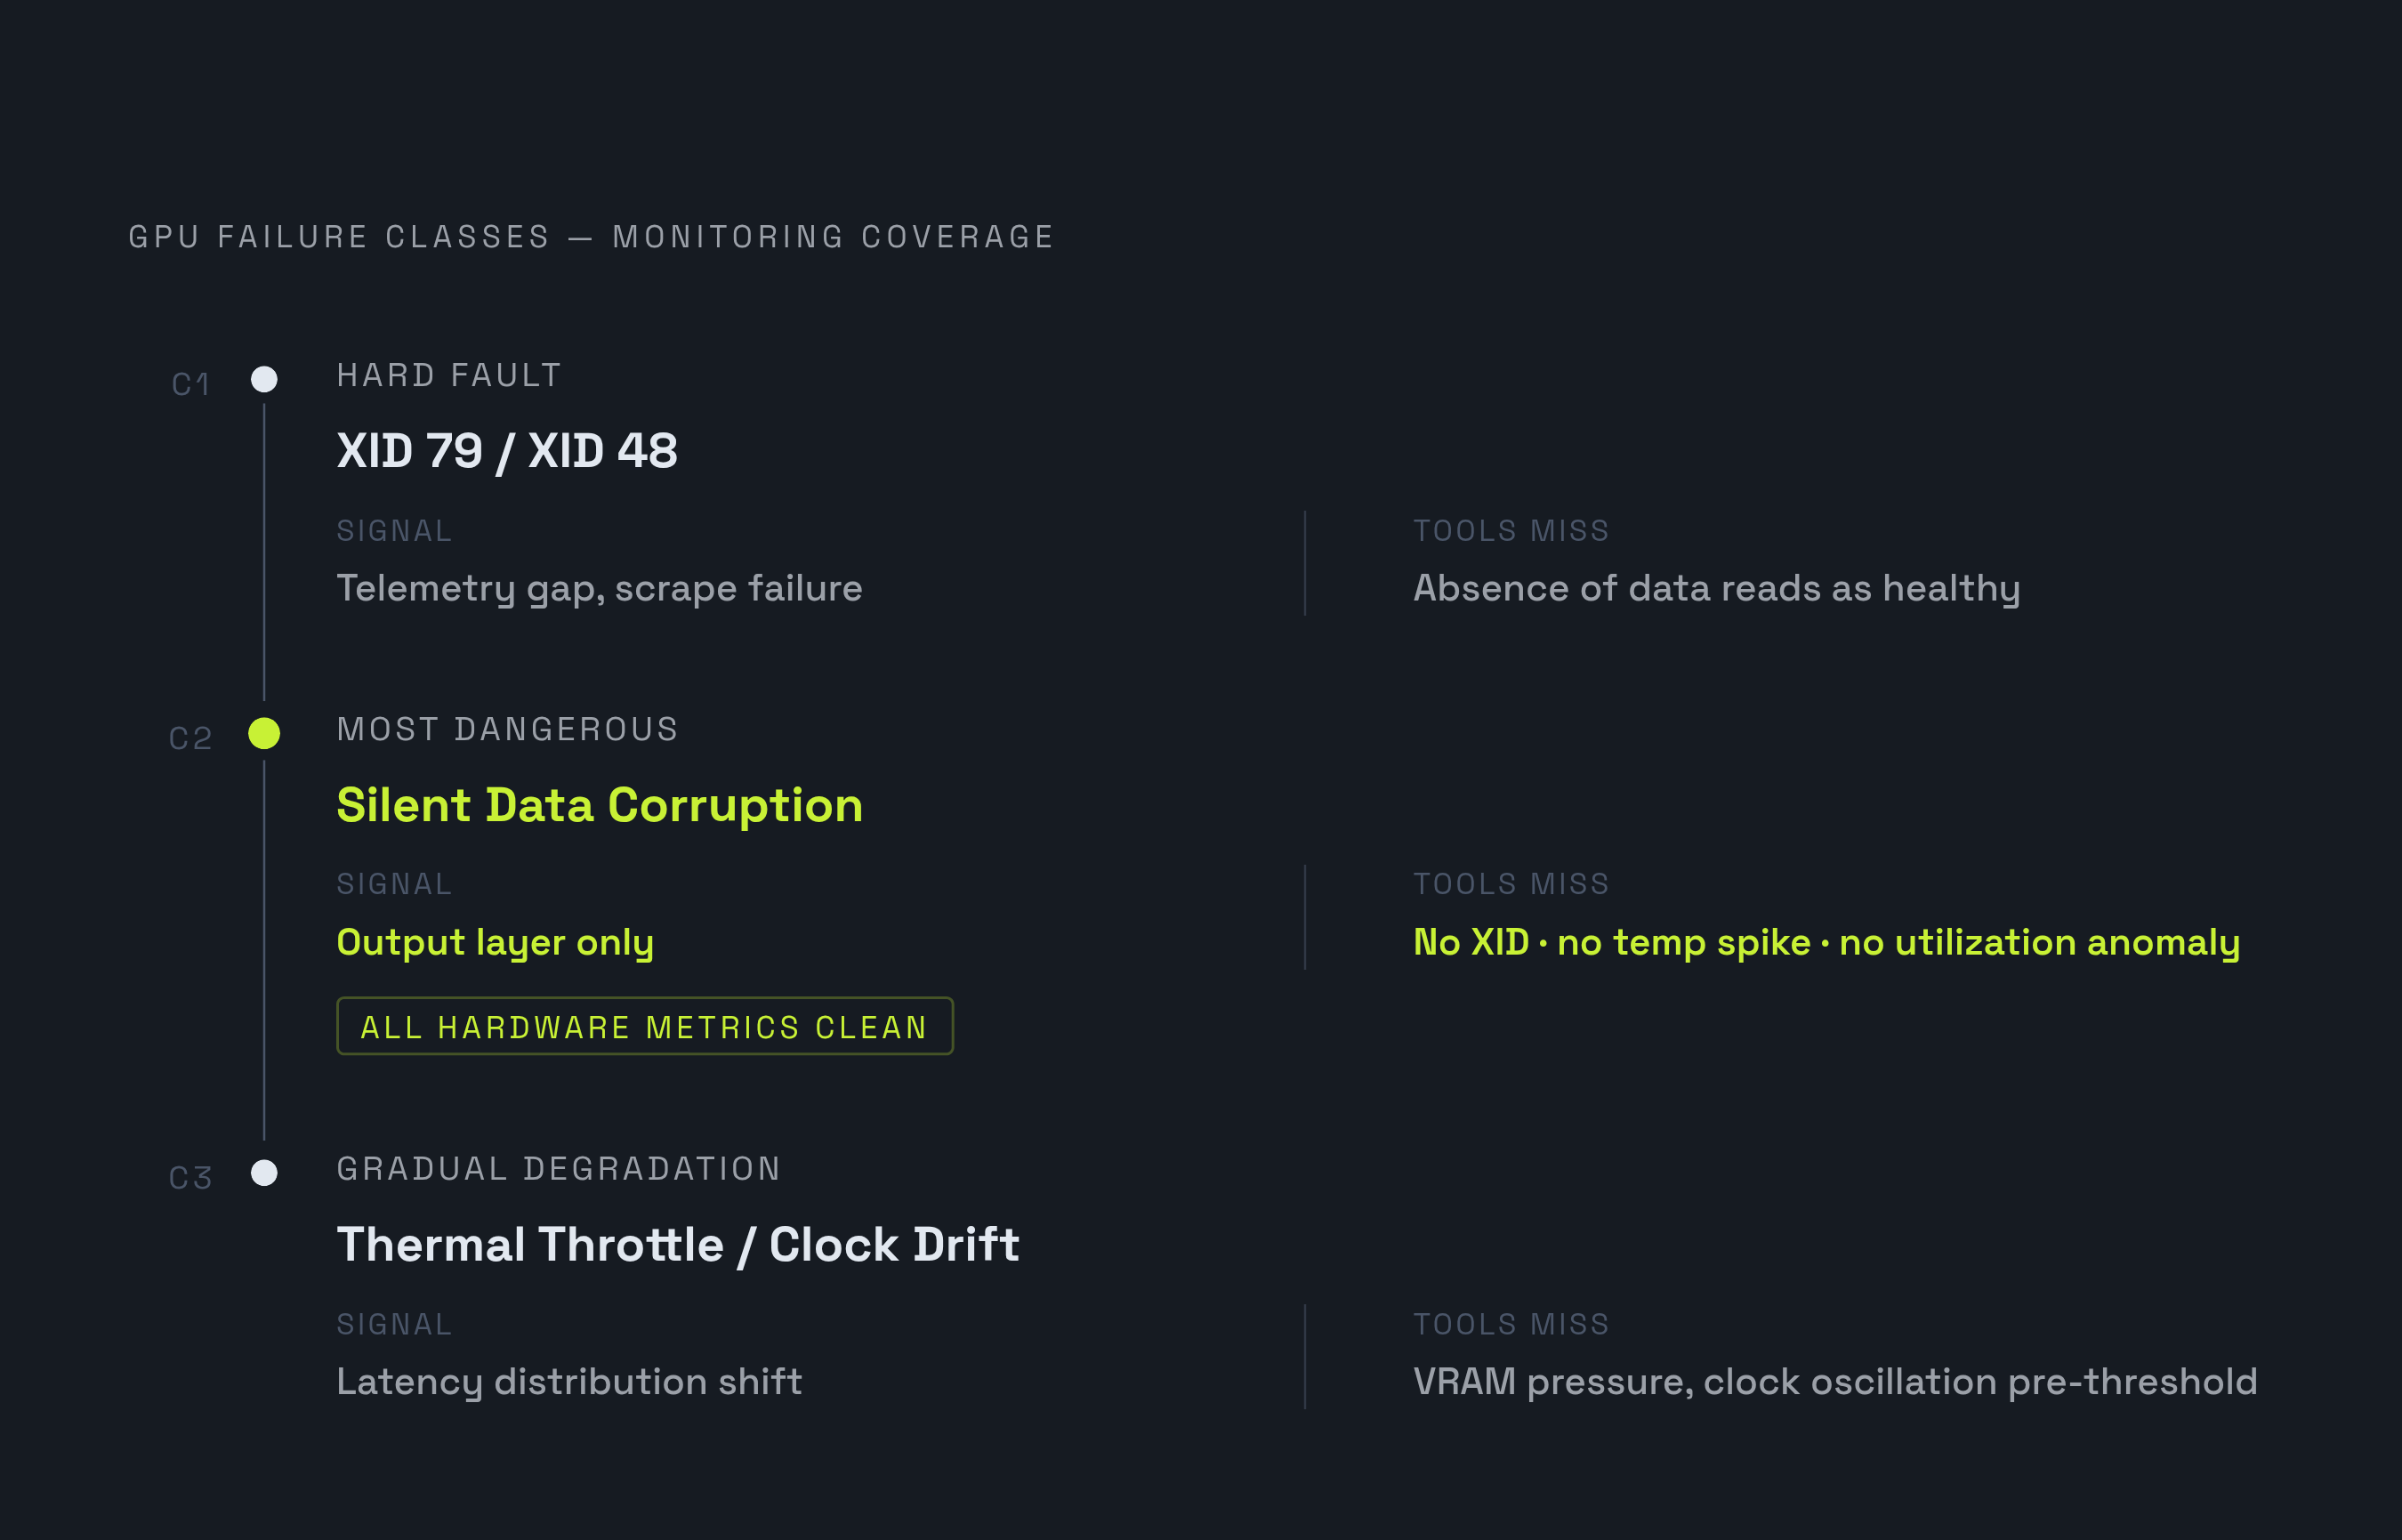
GPU failures in inference production split into three distinct classes, and each one needs its own detection method, not a single generic alert rule.
The first class is hard hardware faults, the detachment kind. XID 79 ("GPU fell off bus") and XID 48 (uncorrectable double-bit ECC error) are at the clear end of this spectrum: the GPU goes unavailable, and what you actually observe is a gap in the telemetry itself. Device metrics disappear. Scrape payloads degrade. Gaps open up in the time series. GWDG's observability framework paper studied seven GPU detachment incidents and found that this monitoring-pipeline breakdown, elevated scrape durations, scrapes that fail intermittently, metric sets that come back truncated, is often the main way the fault shows up. That creates a nasty double bind: the system becomes unstable at the same moment it becomes hard to see clearly.
The second class is silent data corruption, and it's the most dangerous of the three precisely because nothing announces it. The GPU computes the wrong answer and logs no error doing it. No XID fires. No temperature spike. No utilization anomaly. An inference endpoint under silent data corruption looks healthy on every hardware dashboard while serving systematically wrong outputs to real users. You have to watch the output layer itself, response validation and output distribution checks, because hardware telemetry has nothing useful to say.
The third class is gradual performance degradation: thermal throttling, power capping, clock speeds that oscillate, VRAM pressure building over time. These appear first as a shift in the latency distribution, well before any threshold-based alert trips. GWDG's paper describes this class as instabilities that "emerge gradually as weak thermal or efficiency drift," producing weak numeric signals that are visible if you're looking before the conventional alarms ever engage. Specific XID codes, for row-remap events recorded or failed, and for contained or uncontained memory errors, act as precursors here. A hard fault is often preceded by a run of ECC increments and XID bursts tied to remapping state changes.
XID codes 13, 31, 43 (GPU stopped processing), and 45 sit outside the hardware taxonomy entirely and usually point to application bugs, not failing silicon. Treating every XID event as a hardware failure leads teams to replace nodes that were never broken, burning GPU capacity for no reason. Correct triage means reading XID codes against workload context, not reacting to any single code in isolation.
Why standard monitoring pipelines miss inference-specific signals
General-purpose monitoring tools, including the health checks built into Kubernetes, were never designed to see the failures that matter most for inference. Liveness and readiness probes just confirm that a container process is alive and accepting connections. That's all they confirm. They say nothing about GPU compute state, nothing about whether the output coming back is correct, nothing about how the tail of the latency distribution is behaving.
The mistake, as one GPU monitoring guide frames it, is treating GPU visibility as a checkbox inside a general platform. In practice that usually means coarse scrape intervals, a shallow read on nvidia-smi basics with no real ECC or XID depth, and a pricing model where every added pod or MIG series quietly grows the bill. Traditional APM tooling has the same root problem: it was built for request-response web services, and it was never built to track token consumption, model version drift, KV cache hit rates, or per-task GPU utilization, because those concepts didn't exist in the world APM came from.
This gap changes directly how incidents get handled. TSGuard's research documents a workflow where the user reports a problem to the infrastructure provider, who then works it manually, with no automated diagnosis running on the user's side. That's structural, not a staffing problem. It's baked into how the responsibility for diagnosis is divided.
Observability itself can fail as a signal, and most pipelines throw this information away. When a GPU falls off the bus, the monitoring pipeline loses its own telemetry for that device: scrape latency rises, sample counts drop, gaps open in the series. A pipeline that only watches for bad values can't catch a failure whose entire signature is the absence of values. GWDG's framework responds to this by modeling thermal-drift signatures alongside monitoring-pipeline degradation indicators together, because for detachment-class failures the dominant signal is the pipeline's own breakdown.
High-cardinality telemetry makes all of this worse. Inference fleets generate metrics per GPU, container, pod, MIG instance, and job. Scrape intervals tuned for CPU monitoring are too coarse to catch a GPU saturation event that spikes and resolves within seconds. By the time the next scrape runs, the event is gone, and so is any record that it happened.
The metric stack inference endpoints need
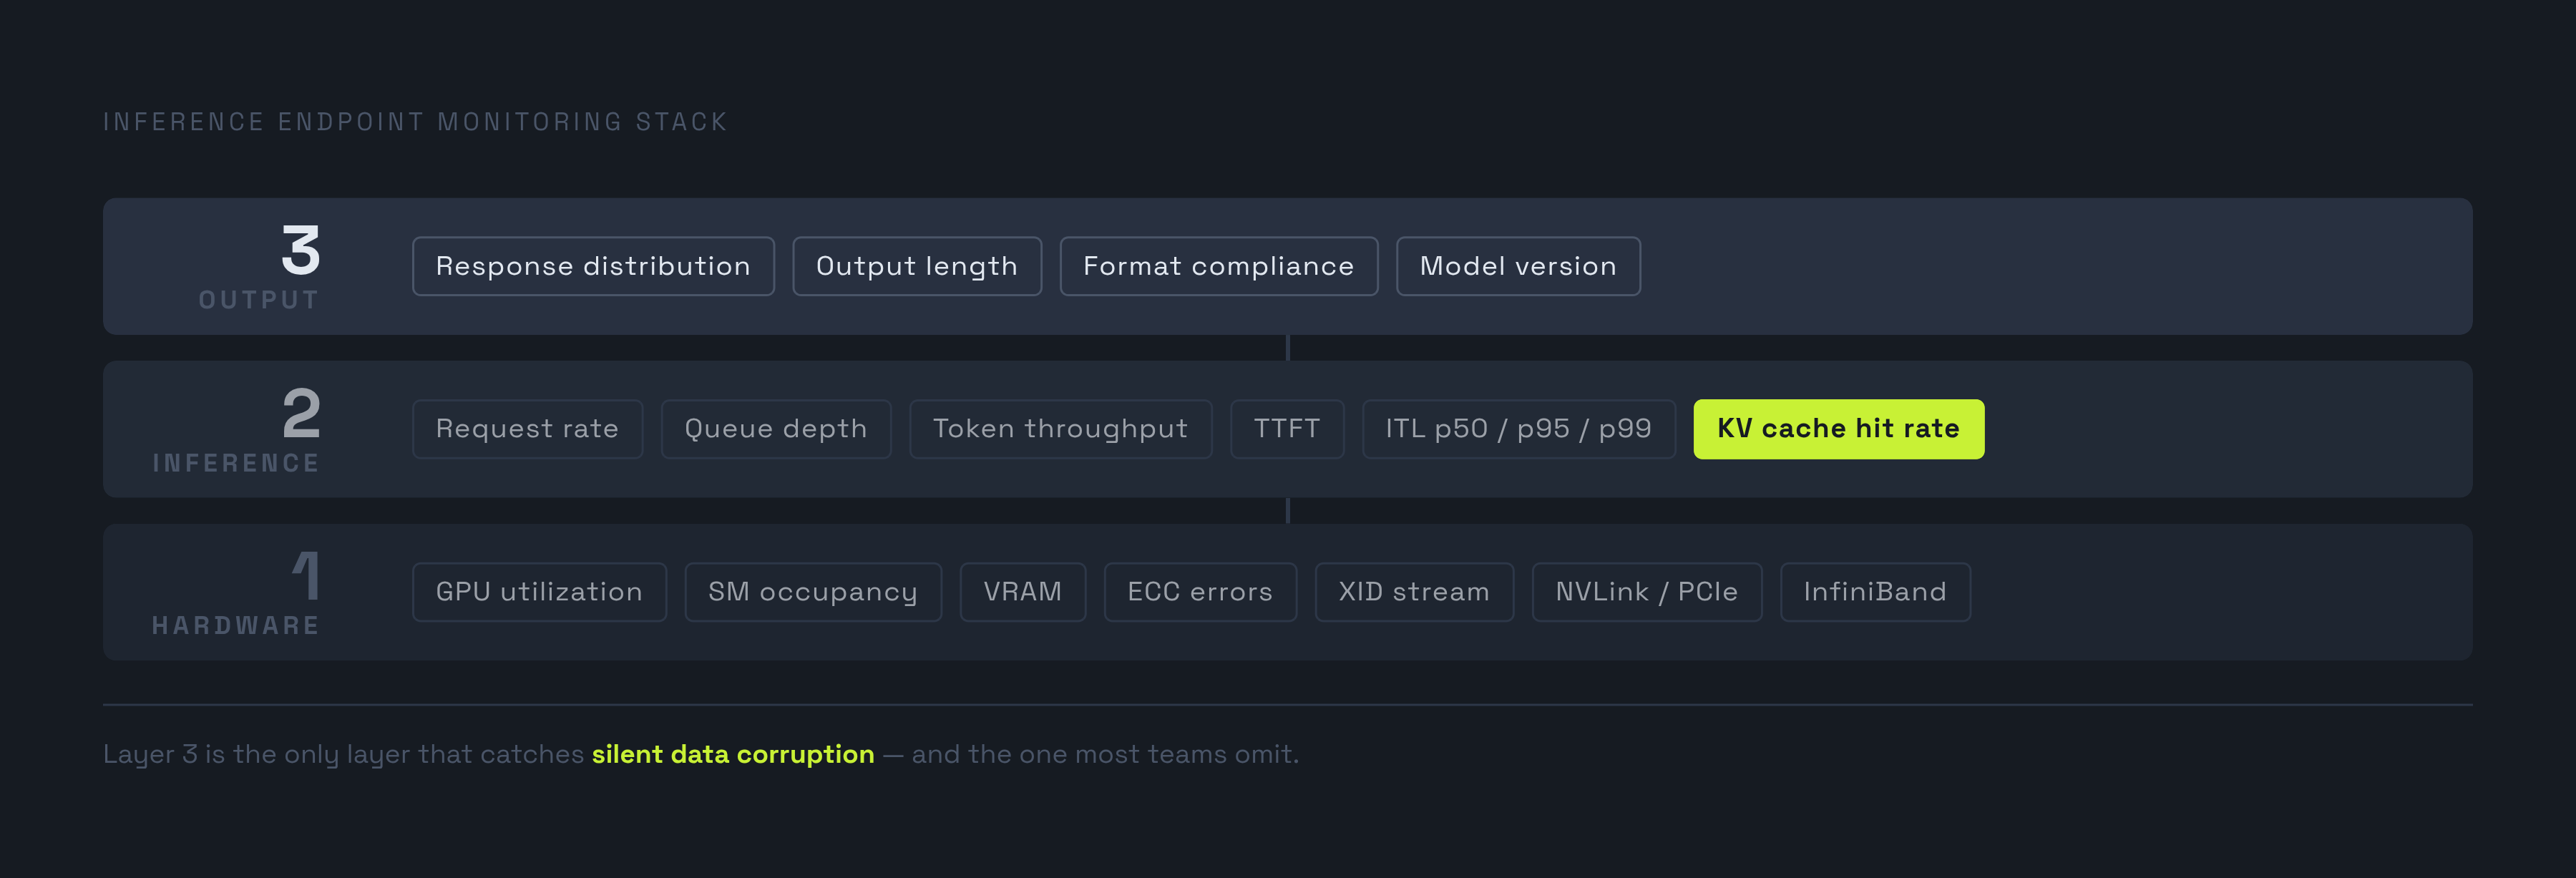
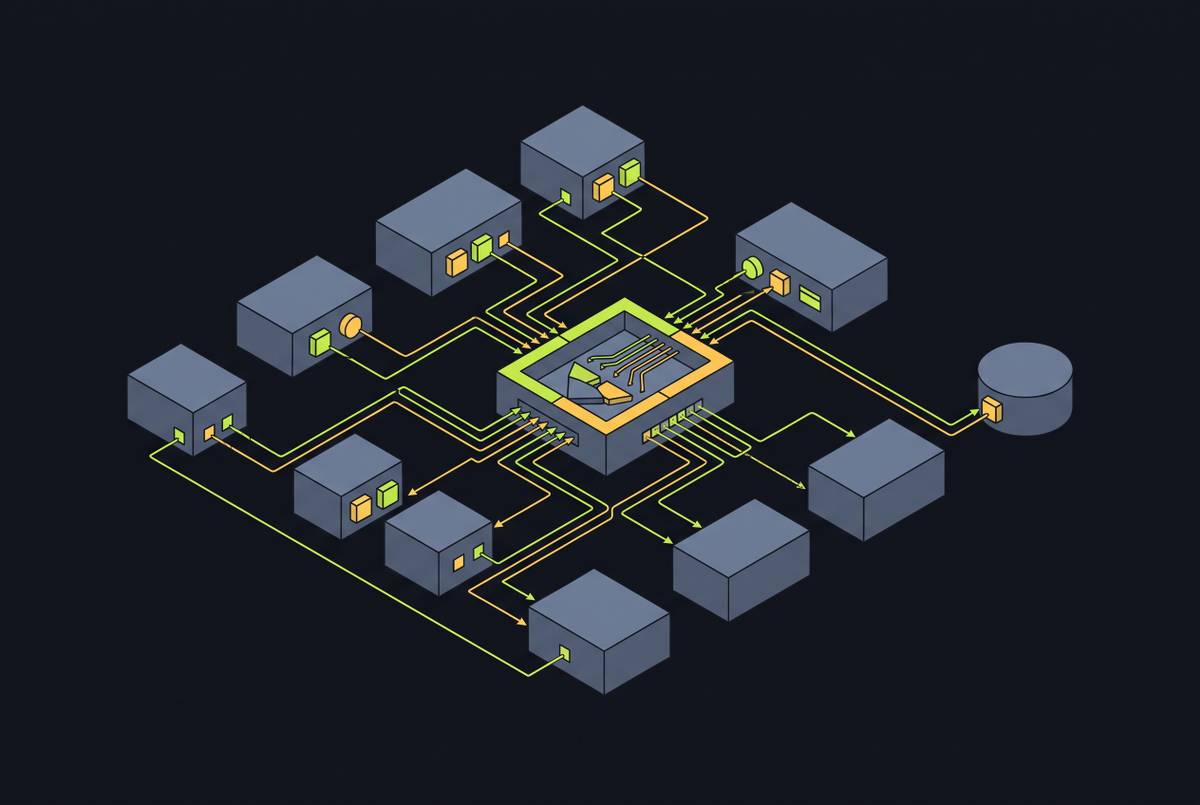
Inference monitoring has to work in three layers at once: hardware health, inference-engine behavior, and output quality. Skipping any one of the three makes a whole class of failure invisible again.
The hardware health layer starts with compute: GPU utilization, SM occupancy, and tensor core utilization, read together so a team can tell actual compute work apart from capacity that's allocated but sitting idle. Memory metrics matter just as much: VRAM utilization, memory bandwidth, ECC error counts split between correctable and uncorrectable, and page fault rates. Thermal and power metrics round this layer out: core temperature, memory junction temperature, power draw against TDP, fan speed, and clock throttling state. The XID error stream needs continuous monitoring, read through the taxonomy already laid out, hardware fault, software fault, or precursor event, each handled on its own terms. Interconnect health belongs in this layer too: NVLink throughput, PCIe bandwidth and error counts, InfiniBand link state. GWDG's paper documents network and InfiniBand issues as their own incident class, separate from GPU detachment, which makes interconnect monitoring a requirement.
One layer most teams build without thinking about costs them later: scrape duration, sample count per scrape, and time-series continuity. This layer catches detachment-class failures because it notices when metrics go missing.
The inference engine layer tracks the serving pipeline itself: request rate and queue depth, with queue wait time working as an early warning for capacity pressure before latency even moves. Token throughput needs to be split into input and output separately, since output tokens cost substantially more compute than input tokens do. Time to first token and inter-token latency matter because they're what users actually feel, and they shift before any aggregate throughput number does. Latency needs to be read at p50, p95, and p99 across all of these, since tail latency is the real SLO signal for inference, not the average.
Pay particular attention to KV cache utilization and hit rate here, because memory pressure on the KV cache is a leading indicator of throughput collapse under batched serving, and general monitoring guides routinely leave it out. AIBrix has shown that a distributed KV cache can meaningfully raise throughput and cut inference latency by 70%, with prefix-aware routing separately cutting both mean and tail latency. KV cache hit rate belongs on the dashboard as a primary metric, not something checked only after a problem starts.
The output quality layer exists for one reason: silent data corruption leaves every hardware metric clean. The only place to catch it is in the output itself, through response distribution monitoring, output length distribution, and format compliance checks. Model version tracking belongs here too, confirming which model version actually served each request and flagging any unintended rollout or version drift before it spreads across traffic.
How node-level automation turns detected failures into recovery actions
Seeing a failure and fixing it are two different problems, and solving only the first one just moves the bottleneck. A team that detects a fault but can't respond to it automatically has traded "we didn't see it" for "we saw it but couldn't act fast enough." Inference SLOs don't leave room for a human in that loop.
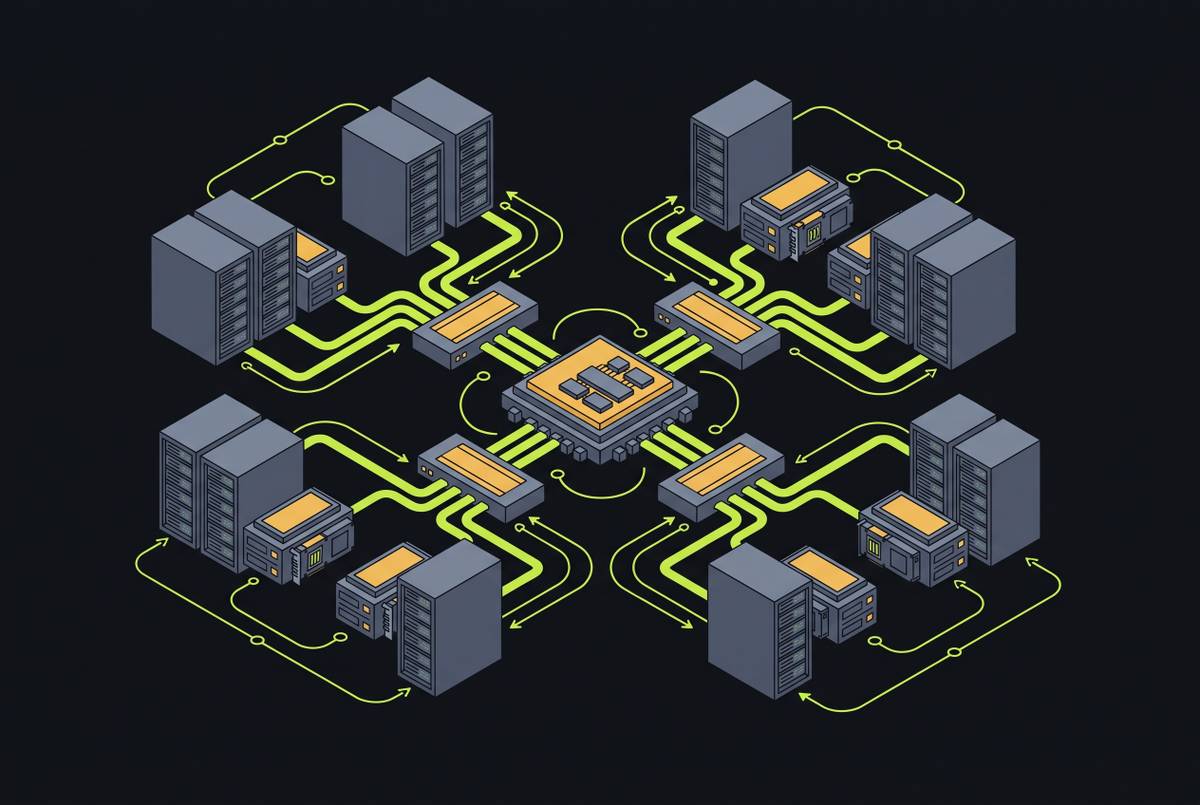
Some of this already exists at the node level. The NVIDIA device plugin runs as a DaemonSet and watches the NVML event stream for critical XID events, marking affected GPUs unhealthy and pulling them out of the Allocatable resource pool. Node Problem Detector, also run as a DaemonSet, reads kernel and driver logs for XID events and sets NodeConditions accordingly, though turning that detection into an actual taint and drain requires something more, a tool like Draino or a custom controller built for the purpose. NVIDIA's DCGM Exporter, running continuously as a DaemonSet, supplies the accelerator-level metrics, compute utilization, memory usage, and XID error counters (ECC counters exist but ship disabled by default), that the Kubernetes scheduler can act on through taints and pod eviction policies.
This taint-and-drain pattern works cleanly for hard hardware faults. But it does nothing for silent data corruption or gradual degradation, because in both cases the node stays perfectly schedulable while it quietly produces bad results. Catching those requires a different layer entirely: application-level circuit breakers and canary health checks that test actual output, not node state.
TSGuard takes aim at the diagnosis bottleneck specifically. Instead of waiting on the provider's manual process, it builds domain-specific knowledge bases from historical on-call data and runs a multi-agent system built to mimic how an expert would diagnose the same incident, and this cuts average verification time substantially compared to running the same checks one after another. AIBrix applies a related idea to serving itself: its SLO-driven GPU optimizer uses offline profiling data and optimization solvers to adjust resource allocation ahead of trouble, rather than waiting for a live metric to cross a threshold before reacting.
The checkpoint comparison is worth making directly. For a training job, a GPU fault means a restart, and the cost of that restart is capped by how often the job checkpoints. Inference has no equivalent built-in safety net. The parallel operation is request retry and replica failover, and both depend on health state being visible in real time, not discovered after the fact.
Early warning before failure: anomaly detection and predictive signals
The biggest gain available in GPU failure detection right now is catching the signs of trouble hours ahead of a hard fault, with enough lead time to move the workload before it is lost.
Fixed thresholds on temperature and utilization don't hold up for inference fleets. They either trip too late, after users have already felt the degradation, or they trip constantly, because GPU utilization naturally spikes and dips under bursty inference traffic. Netdata's approach runs 18 unsupervised machine learning models per metric, retraining them continuously and applying anomaly detection across every GPU metric at once. That matters because GPU incidents tend to hide in the combination of several signals moving together, not in any one number crossing a line.
Remapping failure prediction gives you the clearest published example of what advance warning can look like in practice. Research on GPU observability cites ablation results showing a model predicting remapping failures with a median lead time of 22 hours, enough time to drain a node and reschedule its workloads before anything actually fails.
The precursor pattern differs by failure class, which is part of why no single detector covers all three. Remapping failures are preceded by a build-up of ECC increments, XID bursts, and shifts in remapping state. Detachment-class failures behave differently: GWDG's framework found almost no numeric precursor for these. The early warning there comes from the monitoring pipeline itself, rising scrape latency and falling sample counts, not from any GPU metric moving. Catching it means watching how well the system is being observed, not just what it reports.