Dependency SLA Math and Availability Budgeting
Multiply your dependencies' uptimes to find your real availability—not the weakest link.
A system's real availability is the product of every dependency's uptime, not its weakest link. Multiply four services at 99.9% each and the composite is 99.6%, a full tier below what any single vendor promised. Most engineering teams learn this the hard way, doing the math for the first time in a postmortem instead of during architecture review. That order of operations is backwards, and it's fixable.
Why availability math works differently than most engineers expect
Asking an engineer to describe system reliability usually produces some version of the weakest-link theory: the system is only as strong as its shakiest dependency. It's an intuitive idea, borrowed from chains and bridges, and it's wrong in a way that matters.
Availability is a product. It's a product. Every dependency in a request path has to succeed for the request to succeed, so the composite availability is the multiplication of every individual availability figure, not the floor set by the worst one. Since every factor in that multiplication is a number below 1, the result is always lower than the lowest individual term. Not close to it. Below it.
That gap between "weakest link" thinking and "multiply everything" reality is where SLA breaches come from. Teams find out about the multiplication rule during an incident review, staring at an uptime report that doesn't match anything they promised customers. The math was always available. Nobody ran it first.
What follows here walks through that math in order: how the nines translate into actual clock time, how serial dependencies compound, how parallel redundancy can claw availability back (and where it quietly fails to), how to build an error budget around the number your stack can actually hit, and what all of it means when picking infrastructure and vendors.
Nines in hours and minutes you can spend
Start with the number most SLAs advertise: 99.9%, three nines. Translated into a 30-day month, that's 43 minutes and 12 seconds of allowed downtime, the whole budget, not per incident but total for the entire month. That's the whole budget. Not per incident, total, for the entire month.
Four nines, 99.99%, buys 4 minutes and 19 seconds. Each additional nine divides the allowance by ten. It's a brutal curve. Going from three nines to four nines is not a modest improvement, it represents a steep cut in the time available to fail.
Budget tables don't show that detection speed eats into that number before remediation even starts. A monitoring check that runs every 30 seconds forfeits, at most, half a minute before an alert fires. Reasonable. But a check that runs every 5 minutes can let a quiet outage burn through an entire four-nines monthly budget of 4 minutes 19 seconds before a single page goes out. The incident could resolve itself and still cost the whole month, invisibly, because nobody was watching closely enough to notice it happened.
Daily granularity makes this worse in a different way. A single 15-minute incident, on a single day, caps that day's uptime at 98.96%, below basically every common SLA tier, three nines included. That's below basically every common SLA tier, three nines included. Daily uptime shouldn't be treated as a reporting metric that gets glanced at in a monthly rollup. Treated correctly, it's an early warning system: a bad day appears immediately in the numbers, long before the monthly number has time to average it away.
Serial dependencies compounding into a number smaller than any individual SLA
The formula is simple: A_total = A1 × A2 ×... × An. Every component sitting in series multiplies against every other one. Since each factor sits below 1, the product always comes in lower than any single term in the chain.
Microsoft's own Azure documentation walks through a version of this. App Service publishes a 99.95% SLA. Azure SQL Database publishes 99.99%. Multiplying them produces a composite for that two-service path that comes out to 99.94%, lower than either component alone, with just two dependencies counted. That's with just two dependencies. Most production systems run far more than two.
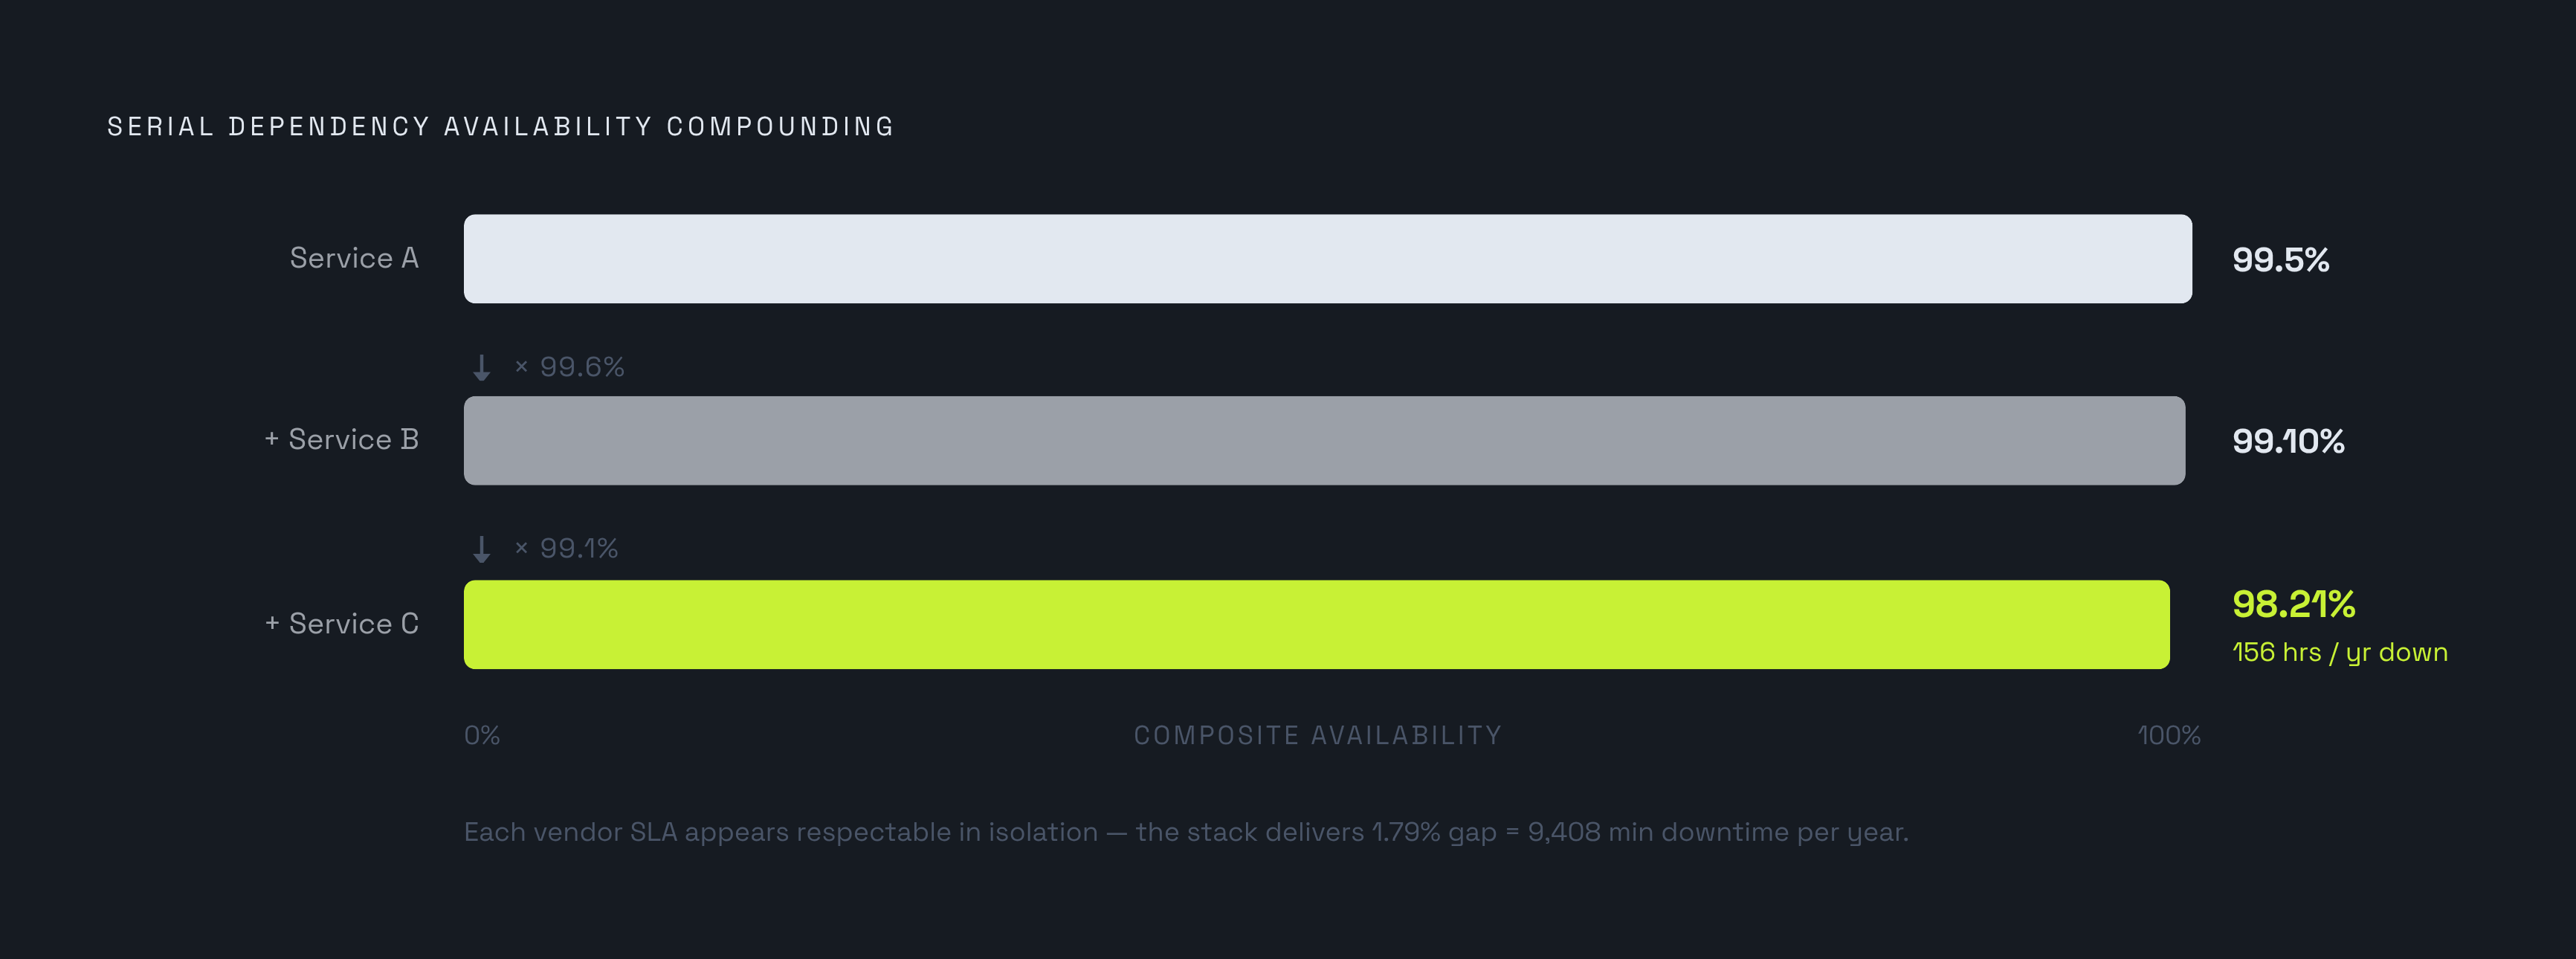
Pushing it to three hard dependencies at 99.5%, 99.6%, and 99.1%, none of which is a bad number on its own, drops the composite to 98.21%. Translated into minutes, that's 9,408 minutes of downtime a year, more than 156 hours. None of the three vendors did anything wrong. The composition did the damage, quietly, through multiplication nobody ran ahead of time.
The dependencies that get missed are usually the ones nobody thinks to draw on the architecture diagram: DNS, authentication services, message queues, third-party payment APIs, the CDN sitting in front of everything. None of them appear in a team's own uptime dashboard because none of them are owned by the team. But each one sits in series in the request path, and each one is a multiplier in the chain whether or not anyone remembers to count it.
How parallel redundancy changes the math
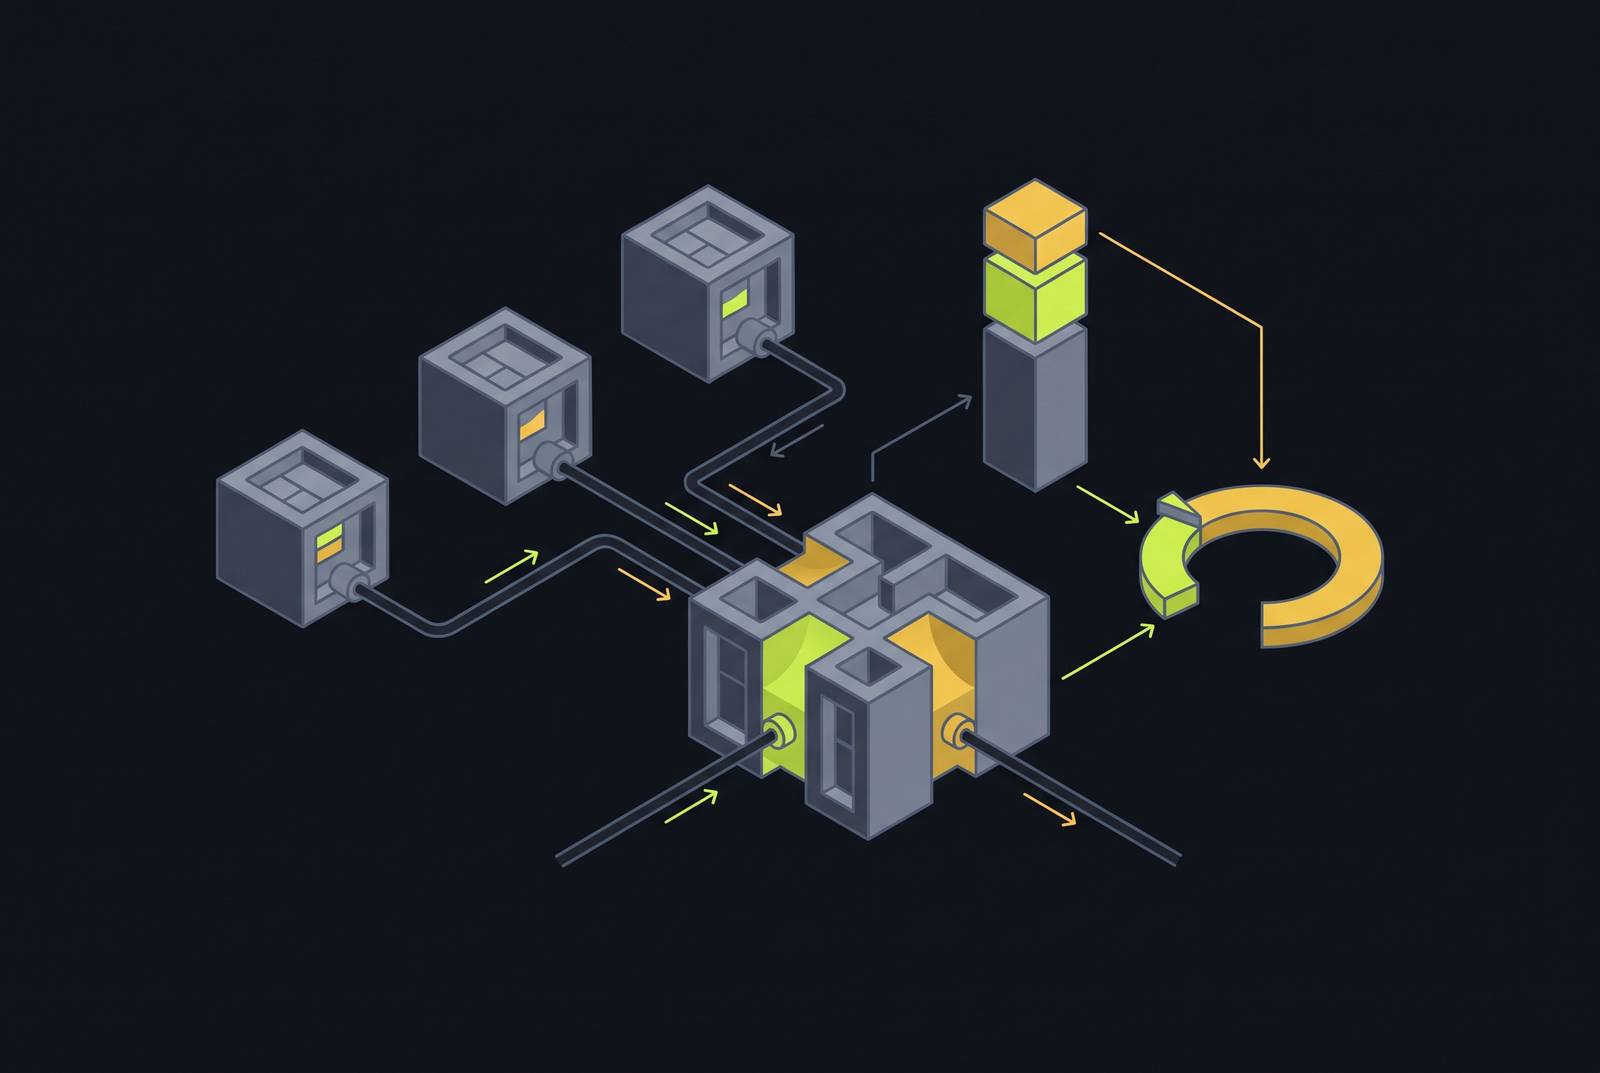
Serial dependencies punish. Parallel ones can help, and the math flips: instead of multiplying availabilities, multiply the unavailabilities. If two independent paths each carry a 0.1% chance of failure, the odds of both failing at the same moment become vanishingly small, a number so tiny it barely shows up on the chart.
Take the Azure database example from before and add a fallback queue running alongside it. The combined path's composite SLA jumps to 99.99999%. Folding that back into the full system calculation raises the overall composite to roughly 99.95%, a meaningful recovery from where the serial chain alone would have landed.
Redundancy isn't free, though. Application logic gets more complex the moment there's a second path to route around. Running the redundant component costs money, sitting there mostly idle, waiting for its moment. And data consistency between two paths becomes its own engineering problem, one that the availability formula does not capture.
The bigger risk sits inside a word that's easy to skim past: independently. The parallel formula only works if the two failure paths are actually independent of each other. Two replicas sitting in the same rack, the same region, or coming out of the same deployment pipeline aren't two failure domains. They're one, wearing a disguise.
Best practice decouples replicas across availability zones or, better, geographic regions, so a cloud provider's regional issue doesn't take out both paths in the same stroke. But geography alone doesn't cover it. Same deploy pipeline means one failure domain regardless of where the servers physically sit: a bad deploy pushes to both replicas simultaneously, and the independence assumption the whole parallel calculation depends on evaporates.
Building an error budget that reflects the stack you run on
An error budget is just the complement of the SLO. Promise 99.9% and the error budget is 0.1%, which works out to about 43 minutes and 50 seconds a month. That's the entire allowance, and it's cumulative across the whole stack, not a fresh pool for each component.
A 15-minute outage early in the month leaves 28 minutes and 12 seconds for everything else. And vendor failures draw from that same pool as internal incidents. A payment API's bad afternoon spends down the same budget as a bug in the team's own deploy. The ledger doesn't care who caused the outage.
Chasing 100% uptime sounds admirable and is actually a trap: it's infinitely expensive to approach, and it slows down every other kind of progress, because a team terrified of touching anything ships nothing. Error budgets exist to give teams permission to move fast on the understanding that some downtime is not just tolerable, it's already been accounted for.
Building the budget correctly means working backward from the ceiling the stack can actually support, not forward from ambition:
- Multiply the SLAs of everything the system depends on, vendors and internal services alike, to find the honest composite ceiling.
- Subtract a margin for the team's own failures, since the composite math above only covers dependencies, not the code sitting on top of them.
Whatever number falls out of that math is the number worth promising. A target the team beats every single month builds more trust with customers than a target breached twice a year, even if the second number looks more impressive on a sales page.
Implications for infrastructure and vendor selection decisions
A platform's own reliability record is an input into this multiplication. Take a documented pair of incidents: a roughly 24-hour outage on June 10, 2025, followed by an 8-hour-and-30-minute incident on June 18, 2025, both on the same platform inside the same month. Measured against a monthly budget, either one of those alone consumes the entire annual downtime allowance for three nines in a single event.
Trajectory matters as much as any single incident. A platform that shifts into a sustaining engineering model, stops shipping new features, and closes enterprise contracts to new customers is signaling something about where its reliability investment is headed. That's not a detail to bury in a footnote when picking infrastructure; it belongs in the same conversation as the SLA number itself.
The practical consequence is blunt: if a platform has already posted a multi-hour outage in a given month, the composite SLA for that month is capped below 99% no matter how clean the team's own code is. A 7.3-hour outage inside a 30-day month works out to 98.99% on its own, before a single line of application logic gets counted.
A few questions cut through vendor marketing faster than anything else:
- Does the platform run inside your own cloud account? If it does, control over the redundancy topology stays with the team, so the parallel-path math above can actually be applied to the architecture. If not, the system inherits the platform's own shared-tenant failure domain, whatever that happens to be.
- Does it offer real multi-zone or multi-region deployment? Correlated failure is the exact failure mode that makes parallel redundancy worthless on paper. A platform that isolates deployments across genuine availability boundaries preserves the independence assumption the whole calculation depends on.
- Does failover and rollback happen automatically? Below roughly five minutes of monthly budget, every incident has to be detected and fixed without a human in the loop. A platform that needs someone to log in and assess the situation before acting cannot support a four-nines commitment, full stop.
A worked example: mapping a real request path and computing its honest availability ceiling
Take a fairly ordinary growth-stage SaaS request path: DNS, then a CDN, then a load balancer, then the application server, then a managed database, then an external authentication provider, then a third-party payment API. Seven hops, each one with a published or reasonably estimated SLA, each one sitting in series.
Multiplying all seven SLAs together produces a composite ceiling that appears well before anyone has factored in a single line of the team's own application code. That ceiling is the honest number, the one that should anchor the SLO.
Somewhere in that chain sits a genuine weakest contributor, and it is not necessarily the hop with the lowest individual SLA. It's the one whose removal, or whose redundant twin, would raise the composite the most. Sometimes that's the payment API. Sometimes it's the authentication provider. The only way to know is to run the multiplication and look at which factor is dragging hardest.
Say the authentication provider turns out to be that dependency. Adding a second, independent authentication path and applying the parallel formula (multiplying the two unavailabilities instead of the two availabilities) can push that leg's contribution close enough to negligible that it stops being the constraint. The improvement is real only under one condition: the two authentication paths have to fail independently. Same vendor, same region, same underlying infrastructure produces two different logins, and the redundancy is theater. Genuine independence, different providers or at minimum different regions and deploy pipelines, is what turns that parallel math from a spreadsheet trick into an availability number worth promising to customers.