Log Aggregation Stack Selection for Growth-Stage Startups
Shift your log stack as you grow to avoid surprise bills and operational overload.
Choosing a log aggregation stack means matching tool complexity, cost, and operating work to the startup’s current stage. The right choice at Series A can become the wrong one by Series C. This framework explains when managed simplicity earns its price, when bulk storage needs a different backend, and when deeper search justifies a platform team’s time.
Why log aggregation decisions keep getting remade as startups scale
When an observability bill is much larger than expected, the team has to decide how to handle logging infrastructure again. The same managed service that barely registered at low volume now charges for streams from more services, more environments, and model-serving workloads. Log volume does not grow neatly with headcount. Per-GB ingestion and per-event indexing turn that widening stream into a bill the original decision never accounted for.
A bad tool is not necessarily responsible. A ten-engineer team and a hundred-engineer team have different capacity to operate infrastructure, and different reasons to pay someone else to do it. A managed platform bundles collection, processing, storage, and query into one surface, while a separated pipeline lets those responsibilities change independently. The useful comparison is therefore between architectures at each growth stage.
What a log aggregation pipeline actually does, and where the costs hide
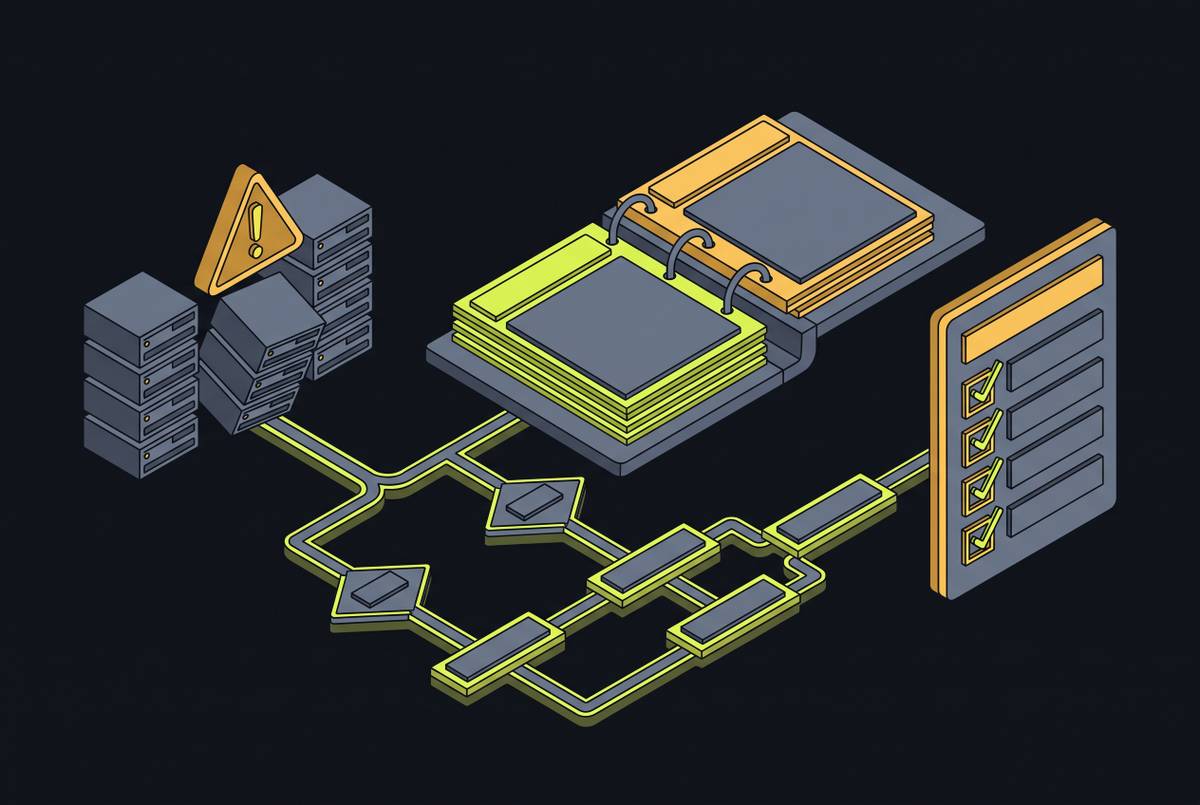
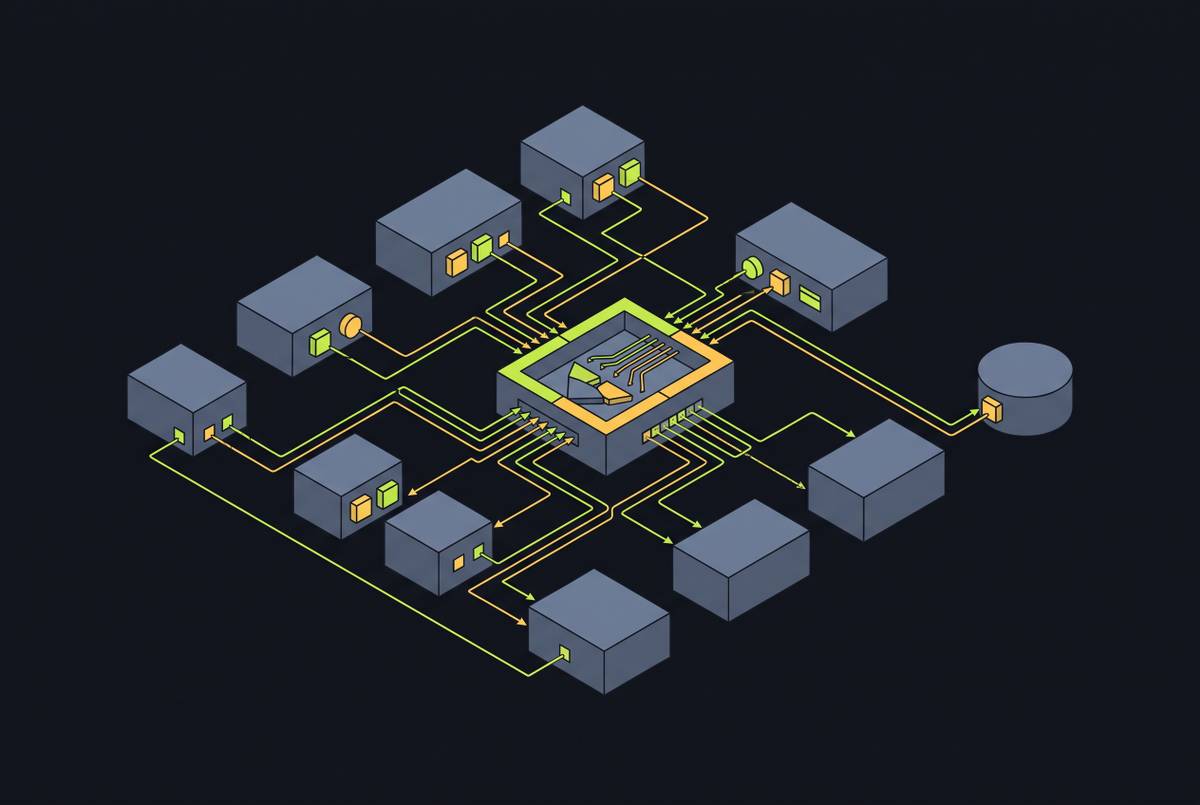
Collection starts when agents read files, journald, syslog, container output, OTLP endpoints, or cloud log streams. Enrichment adds service, environment, cluster, namespace, and region so incident responders do not have to assemble that context manually. Processing parses lines into fields, normalizes schemas, redacts sensitive values, and filters noise. Buffering and routing absorb short destination failures, batch events, and send streams to their backends. Storage and analysis retain the data for queries, dashboards, and alerts.
Most of the bill lives at the end. Full-text indexing, including Elasticsearch’s default indexing through Lucene, provides deep search but increases storage costs sharply at scale. Loki indexes labels instead, lowering storage costs while limiting ad hoc query flexibility. Parseable uses Apache Parquet on S3-compatible object storage, trading some query latency for cheaper long retention.
Per-GB ingestion charges are based on how much data comes in, while per-event indexing charges make lots of small lines costly for their byte count. Keeping collection separate from storage lets a team change the backend without rewiring every application. It also makes failures easier to isolate.
The collector layer: which pipeline tool fits which environment
For Kubernetes and host collection, Fluent Bit is the natural starting point. It trades plugin breadth for a low resource footprint, which suits many small nodes. Filesystem buffering is optional. For logs, metrics, and traces together, OpenTelemetry Collector can serve as the agent or gateway and has file-backed sending queues. That vendor-neutral routing layer helps avoid later re-instrumentation.
Complex transformations point toward a different choice. Vector offers disk buffers, richer transformation logic, and multi-destination routing when heterogeneous sources need normalization before delivery. Grafana Alloy fits teams already using Grafana Cloud, Loki, Mimir, Tempo, or Prometheus-compatible workflows. Fluentd earns its higher resource overhead when its mature plugins cover an unusual source or destination. All five are open source and self-hosted.
Elastic deployments have more specialized options. Logstash fits complex event parsing with persistent queues, while Filebeat ships host logs into the Elastic stack with a disk queue. Both are Elastic-licensed and self-hosted. Commercial options address other needs, with Cribl Stream for central enterprise routing, Mezmo Telemetry Pipeline for visual transforms, and another vendor’s platform for centrally managed collector fleets.
Early stage: managed simplicity over operational control
A two- to five-person engineering team usually has no dedicated platform or DevOps capacity. Every hour spent tuning logging competes with product work. A service should provide log search, alerts, and incident investigation without a separate operations project. At this stage, managed simplicity is a deliberate purchase of engineering time.
Better Stack combines logs, uptime monitoring, on-call, incident management, and status pages. Its log interface includes Live Tail, SQL and PromQL exploration, and a drag-and-drop query builder. The free allowance is 3 GB/month retained for three days, with per-GB ingestion and retention fees applying beyond the included service. That integrated surface suits small teams avoiding component assembly.
Other managed choices make the same trade differently. SigNoz offers cloud and self-hosted deployment, combining OpenTelemetry-native logs, metrics, traces, exceptions, dashboards, and alerts over ClickHouse. Its startup program has a low monthly rate for early-stage companies that qualify. New Relic and Datadog provide broad integrations without pipeline assembly, though telemetry volume and custom metrics need active management to contain later costs. The recommendation applies to the category.
Growth stage: when volume makes the managed bill the problem
Growth changes the decision when observability spending rises faster than headcount. The first lever is how much data gets indexed. Routing some events to cold storage or archive preserves the data without paying to keep every event fully indexed. Teams also need to watch high-cardinality labels, because pod names, request IDs, and user IDs can multiply the cost of custom metrics within a billing cycle.
Teams can move logs to Loki and S3, keep application performance monitoring managed, and use tail sampling for traces. Loki fits Grafana and Kubernetes teams that accept label-based indexing and its limits on full-text search. Alloy provides a natural collector pairing, with Mimir handling metrics. The savings depend on the workload and routing choices.
Parseable offers another route for bulk retention. Its SQL interface queries S3-native columnar storage, keeping older data queryable without a hot index. It accepts OpenTelemetry data and supports logs, metrics, events, and traces, with cloud or self-hosted deployment. An OTel gateway can route these signals to different backends while the managed platform retains alerting and APM correlation. That separates the expensive storage decision from application instrumentation.
Scale stage: full-text search, multi-cloud fragmentation, and the Elasticsearch question
At scale, search across incompatible sources becomes a larger part of the problem. AWS CloudTrail, Azure Monitor and Activity Logs, and GCP Cloud Audit Logs do not share a schema. Without normalization, cross-cloud investigation becomes manual hunting across separate query interfaces. Inconsistent schemas also undermine correlation rules, producing false positives and alert fatigue.
Elastic Stack is worth the cost of running it when the team has a strong need for full-text search and complex aggregations. Elasticsearch indexes every field by default through Lucene, while Kibana supplies dashboards and Elastic SIEM adds threat-focused workflows. Self-hosting beyond a few nodes requires dedicated ingest, storage, and master nodes, index lifecycle management, and SSL/TLS on every transport path. A dedicated platform team can absorb that work. Moving aging data from hot to warm to cold storage controls how much remains in expensive indexed tiers.
Security investigations can make a platform with more tools worth the cost instead. Splunk combines search across messy sources, SPL analytics, and SIEM, with Heavy Forwarders preprocessing logs before indexing. It fits shared security and operations workflows, but each source adds cost and tuning work. Sumo Logic offers SaaS-based security and compliance across cloud, Kubernetes, and on-premises sources. These tools answer needs that a small team’s lightweight logging service does not have to meet.
AI and ML workloads as a special case inside any growth stage
AI workloads break the simple progression from small team to simple stack. Latency per token, cost per inference call, GPU utilization, model drift, and training-data access are operational signals from the start. Request counts and error rates are not enough. A training run can overwhelm a pipeline sized for application logs, while inference serving adds continuous structured output.
Planning these signals into the existing pipeline avoids building a separate one later. A typical AI observability stack combines Prometheus, Grafana, OpenTelemetry, the DCGM exporter for GPU metrics, and a policy layer. GPU utilization and cost per token belong on dashboards from the first deployment.
Teams must also keep audit records for regulated training data. Each access needs a timestamp, accessor identity, action performed, and a reference to the data accessed. Automatic structured JSON records make that activity auditable without manual correlation. The framework still applies, but signal diversity and compliance can force architectural choices before the team grows.
Compliance requirements as a log architecture constraint, not an afterthought
SOC 2 Type II and HIPAA constrain retention, continuity, and protection against modification. HIPAA security control documentation, including audit records, must be retained for a minimum of six years. WORM configurations, strict access controls, and centralized log management provide mechanisms for tamper-evident storage. Retention is therefore more than a storage setting. The architecture must also prevent operational teams from modifying the evidence.
SOC 2 Type II needs continuous evidence of control operation throughout the audit period. When logging starts late, keeping the logs longer cannot fill in what was missed. A pipeline in scope needs structured, continuous, tamper-evident output from its first day. Separating production streams from staging and development keeps investigation noise out of audit evidence, with a log management platform’s stream model offering one implementation.
Scope also shapes the cost of that architecture. Each Trust Services Criterion left out of scope removes whole groups of control requirements. For a growth-stage startup, defining scope narrowly at the start helps control the logging component of compliance spending. Planning retention before audit pressure arrives avoids an expensive rebuild when continuity is already under examination.
A framework for making the tool decision at each growth stage
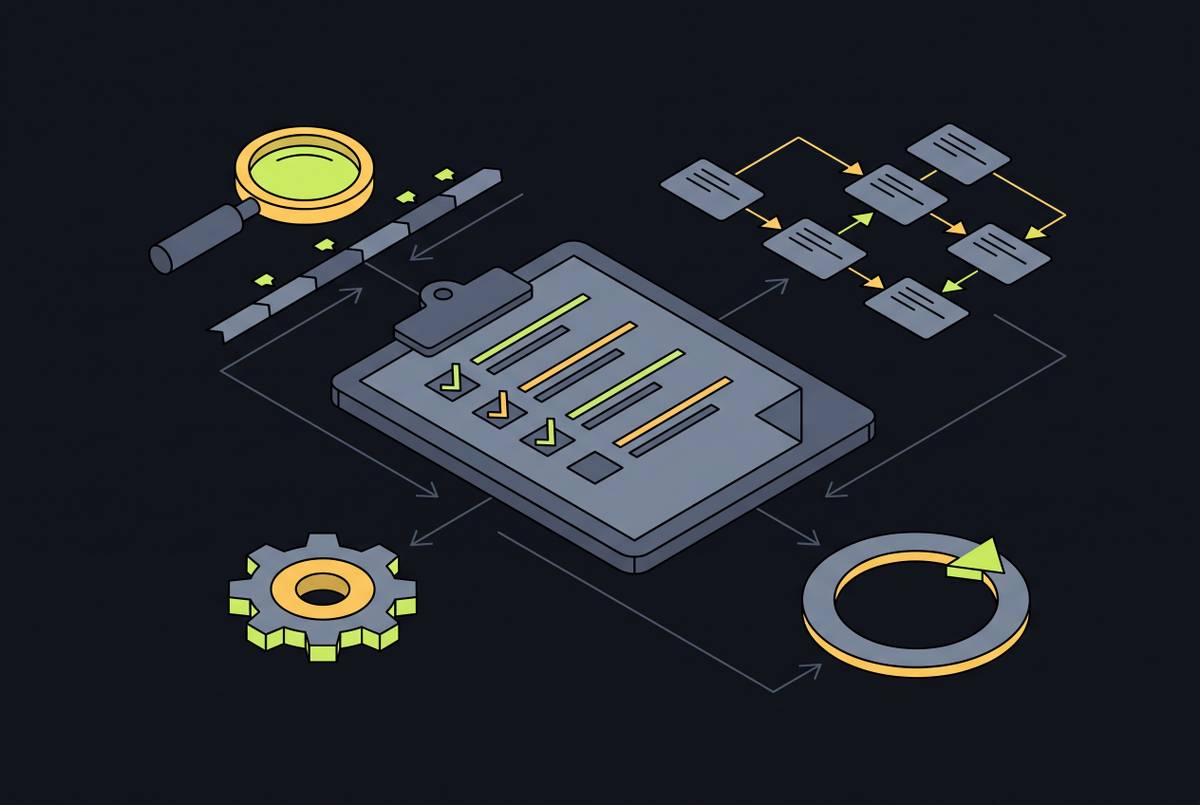
The working framework starts with four variables, namely operational capacity, volume and cost trajectory, compliance obligations, and signal diversity. How much platform time is actually available? With no time set aside for it, managed SaaS spares the team more operations work than it can handle. A team that has time for part-time work can run a hybrid design, while a dedicated team can take full control of the pipeline and handle deeper indexing.
Is the bill small, or growing faster than headcount? Low volume favors simplicity, while a rising bill calls for selective indexing before a backend migration. Multi-service, multi-cloud environments add a need for normalization and schema governance. Compliance then narrows the options through retention, continuous collection, and tamper-evidence requirements.
Signal diversity determines what must stay connected. Teams with logs alone have many backends to choose from, while teams with logs, metrics, and traces benefit from vendor-neutral routing and one place to correlate them. AI adds GPU metrics, inference traces, and token-cost tracking. Where the pipeline can run affects all these choices, especially when it must run inside the team’s own cloud account.
A shortlist still needs practical questions rather than feature counts. Which sources can it collect, how quickly can incidents be queried, and how does retention get charged? Teams also need to ask where each platform can run, which workflows it covers, and what trade-off it makes. Those answers describe a fit for the current stage. The next decision is how to leave that fit safely when conditions change.
Migrating the log stack without breaking the observability surface
Application instrumentation is expensive to change. A routing tier makes the path from collector to backend easier to replace incrementally. Before replacing storage, selective indexing can provide an initial saving by sending less-used events to archive while preserving recent-event queries. If a backend change is still warranted, the migration can proceed without one abrupt cutover.
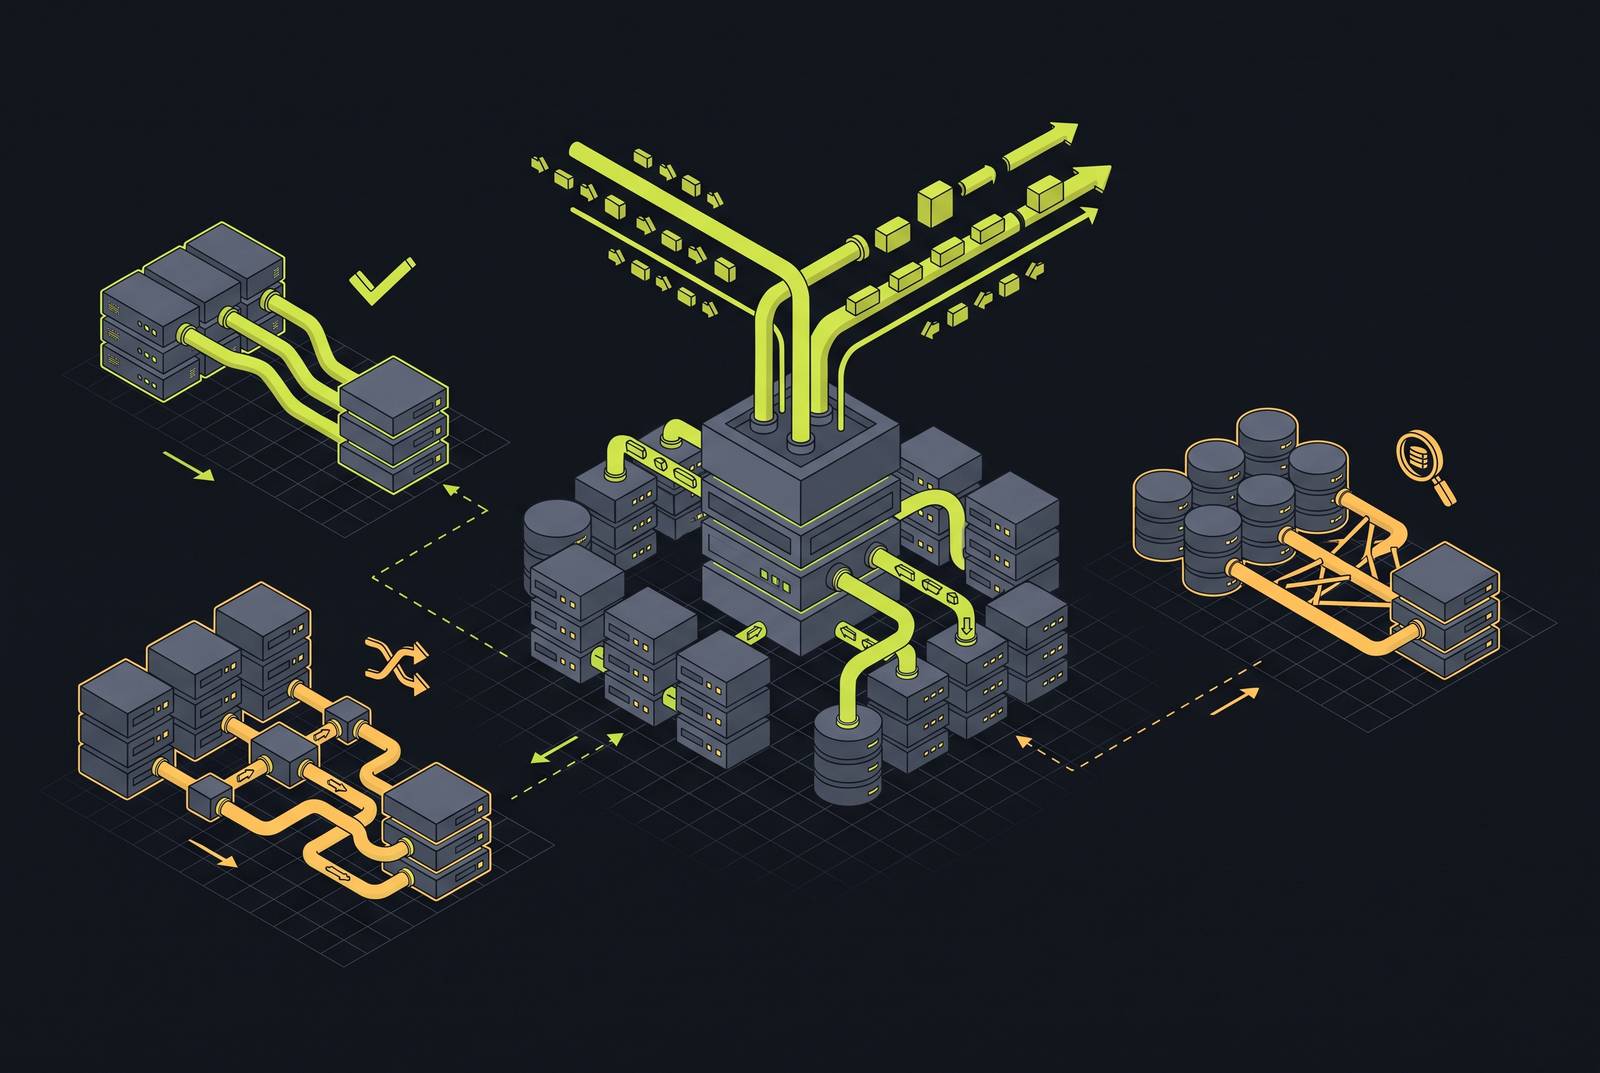
The practical sequence starts by inserting OTel Collector or Vector in front of the existing backend. The team then validates delivery from every source before adding a second destination and sending it a copy of the stream. Both backends run in parallel for a defined period. That overlap provides time to check incident timelines and evidence records for gaps before cutting over and decommissioning the old backend.
The new backend must produce continuous, tamper-evident output from the moment it enters scope, and the parallel run must overlap the audit period when evidence depends on log continuity. If the infrastructure deployment boundary is changing too, the logging migration needs to land in the same environment. The planning session should settle source validation, the parallel-run period, continuity checks, and the cutover before assigning the old backend a shutdown date.